South Bend and Elkhart forecast 2024

Director of the Bureau of Business and Economic Research and Professor of Economics, Judd Leighton School of Business and Economics, Indiana University South Bend
In 2023, the labor markets in the South Bend-Mishawaka and Elkhart-Goshen MSAs exhibited a modest degree of loosening. The size of the labor force either remained stable or experienced a decline in regions marked by higher unemployment rates. Despite an uptick in wage rates in both areas, overall labor costs were mitigated by a reduction in working hours. Within the context of these dynamics, housing prices in St. Joseph County continued their upward trajectory, even as new single-family home construction and sales of existing homes experienced a notable decline.
Labor force and employment
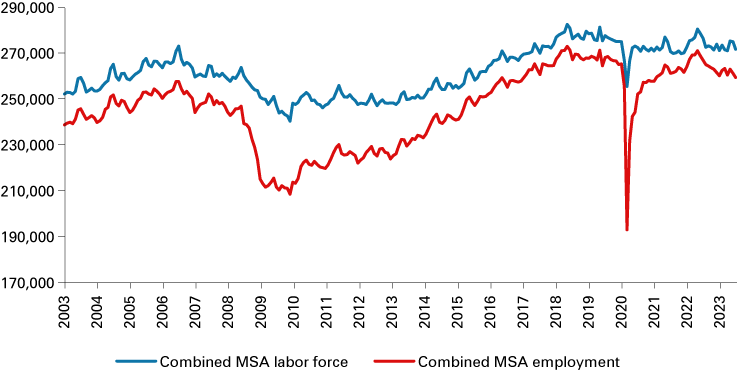
According to data from the U.S. Bureau of Labor Statistics, the combined labor force in the South Bend-Mishawaka and Elkhart-Goshen MSAs averaged 272,805 in the first eight months of 2023. This figure represents a decrease of 2,943 compared to the previous year.1 The monthly trends of the labor force and employment of the combined region are displayed in Figure 1.2 Specifically, the labor force increased by 689 individuals in the South Bend-Mishawaka MSA, while the Elkhart-Goshen MSA saw a decline of 3,632.3 Notably, when comparing these figures to the pre-pandemic level, the South Bend-Mishawaka MSA remains 6,942 individuals below the 2019 figure, whereas the Elkhart-Goshen MSA has exceeded the 2019 figure by 2,012.4
In the period from January to August of 2023, total employment in the combined region averaged 261,387, which reflects a decrease of 5,817 jobs compared to 2022 (-2.2%). More specifically, the South Bend-Mishawaka MSA experienced a loss of 234 jobs (-0.2%), while the Elkhart-Goshen MSA witnessed a more significant decrease of 5,583 jobs (-4.8%). It's worth noting that during the same period, the state and national employment growth rates were 0.3% and 1.8%, respectively.
Figure 1: Labor force and employment in the South Bend-Mishawaka and Elkhart-Goshen MSAs combined

Note: Data are shown through August 2023 and are not seasonally adjusted.
Source: STATS Indiana, using U.S. Bureau of Labor Statistics data
Unemployment
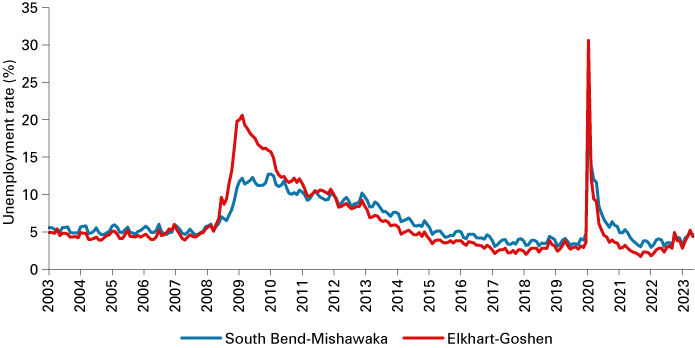
The unemployment rate increased in both metropolitan areas in 2023. Figure 2 illustrates the South Bend-Mishawaka and Elkhart-Goshen MSAs’ unemployment rates from January 2003 to August 2023. In 2023, the South Bend-Mishawaka MSA exhibited an average unemployment rate of 4.2%, marking a 0.5 percentage point increase from 2022 and a 0.4 percentage point increase from the 2019 rate.5 The Elkhart-Goshen MSA’s unemployment rate reached 4.1% in 2023, representing a 1.7 percentage point surge from the 2022 rate and a 0.9 percentage point increase compared to the pre-pandemic unemployment rate in 2019.6 Notably, when compared to both state and national statistics, the unemployment rates in both MSAs exceeded the corresponding state and national averages in 2023 (3.5% for Indiana and 3.7% for the U.S.).
Figure 2: Unemployment rate in the South Bend-Mishawaka and Elkhart-Goshen MSAs

Note: Data are shown through August 2023 and are not seasonally adjusted.
Source: STATS Indiana, using U.S. Bureau of Labor Statistics data
Employment by industry
Based on the business establishment survey from the Bureau of Labor Statistics, the total nonfarm employment in the South Bend-Mishawaka MSA averaged 139,138 between January and August 2023, marking an increase of 2,500 jobs (+1.8%) compared to the same figure in 2022.7,8 Table 1 presents the breakdown of sectoral employment in 2023 and the associated change since 2022. It is important to note that the total nonfarm employment in 2023 is still 7,087 below the 2019 level. All sectors experienced job growth, except manufacturing and information. This growth was led by the leisure and hospitality industry (+775 jobs), followed by other services (+688); private educational and health services (+513); and natural resources, mining and construction (+488). Manufacturing recorded a loss of 588 jobs and there was no employment change in information.
The total nonfarm employment in the Elkhart-Goshen MSA averaged 141,350 between January and August 2023, 3.6% below its 2022 level and 2.4% higher than the pre-pandemic figure in 2019.9 Major sectors lost jobs, including manufacturing (-6,113 jobs), professional and business services (-750) and government (-113). Conversely, sectors that experienced employment growth included leisure and hospitality (+475); trade, transportation and utilities (+313); natural resources, mining and construction (+300 jobs); private educational and health services (+288); and other services (+188).
Table 1: Year-to-date employment by industry and metro area
| Industry | South Bend-Mishawaka | Elkhart-Goshen | ||
|---|---|---|---|---|
| Employment in 2023 | Change since 2022 | Employment in 2023 | Change since 2022 | |
| Total nonfarm | 139,138 | 2,500 | 141,350 | 5,300 |
| Natural resources, mining and construction | 6,388 | 488 | 4,538 | 300 |
| Manufacturing | 15,113 | -588 | 70,688 | -6,113 |
| Trade, transportation and utilities | 25,863 | 113 | 21,438 | 313 |
| Information | 1,400 | 0 | 500 | 25 |
| Financial activities | 5,950 | 175 | 2,825 | 88 |
| Professional and business services | 13,900 | 163 | 9,913 | -750 |
| Private educational and health services | 34,863 | 513 | 11,638 | 288 |
| Leisure and hospitality | 14,800 | 775 | 7,575 | 475 |
| Other services | 6,388 | 688 | 4,300 | 188 |
| Government (includes public schools and hospitals) | 14,475 | 175 | 7,938 | -113 |
Note: Data are for January through August 2023. Data are not seasonally adjusted.
Source: STATS Indiana, using Current Employment Statistics (CES) data from the U.S. Bureau of Labor Statistics
Local wages and hours worked
Both MSAs saw their labor costs continue to rise in 2023. Average hourly earnings for the private sector increased by 3.2% to $28.62 in South Bend-Mishawaka and by 4.5% to $31.38 in Elkhart-Goshen. Meanwhile, average work hours saw a decline of 3.2% to 33.0 hours per week in South Bend-Mishawaka and a 4.0% decrease to 35.8 hours per week in Elkhart-Goshen. Consequently, the average weekly earnings experienced a slight reduction of 0.2% to $943.47 in South Bend-Mishawaka, but recorded a 0.4% increase to $1,123 in Elkhart-Goshen.
Housing
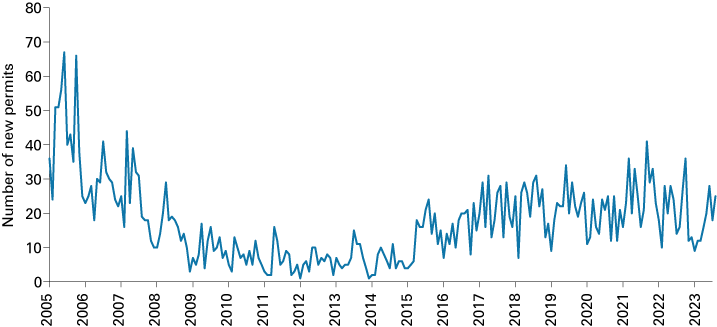
The local housing market remained sluggish in 2023. Figure 3 depicts the issuance of single-family residential building permits in St. Joseph County, spanning from January 2005 to August 2023. In the first eight months of 2023, St. Joseph County issued 140 new permits for single-family home construction. This figure represents an 11.4% decrease from the previous year and a 20.9% decline from the pre-pandemic levels of 2019. Furthermore, statistics from the Indiana Association of Realtors indicated an 11.2% drop in new listings for existing homes in St. Joseph County and a 12.0% reduction in closed sales from January to August of 2023.10 However, it is worth noting that the median sales price experienced a 2.5% increase in 2023, reflecting a slower pace compared to the significant 16.3% surge observed in 2022.
Figure 3: Single-family residential building permits in St. Joseph County

Note: Data are shown through August 2023.
Source: St. Joseph County Building Department
Forecast
Examining the prospects for 2024 reveals a landscape filled with both risks and opportunities. On the brighter side, inflation has shown signs of slowing in 2023. According to data from the Bureau of Labor Statistics' Consumer Price Index, the 12-month percentage change average in the inflation rate was 7.98% in 2022, while the first nine months of 2023 witnessed an average 12-month inflation rate of 4.47%. Moreover, the annualized inflation rate from June to September dipped below 4.0%, marking a decline from the 5.58% recorded in the first four months of 2023. This suggests a steady downward trend in prices. Should this trend persist in 2024, households may experience minimal erosion in their real income, potentially keeping consumer spending robust.
On the flip side, inflation continues to hover well above the Federal Reserve's 2% target. The likelihood of reaching this target in 2024 appears slim, necessitating the Fed's ongoing commitment to a tightened monetary policy through the year. Notably, the effective federal funds rate reached 5.33% in October 2023, the highest level since 2006. Prolonged high interest rates in 2024 are expected to curtail both business investments and household consumption, ultimately reducing aggregate demand. However, the specter of recession appears to be waning. The October National Association for Business Economics Policy Survey reports that “fewer respondents than in the previous survey expect a recession within the next 12 months, with most assigning a probability of 50% or less.”11 In sum, a prevailing tightened monetary policy is likely in 2024, with the economy expected to slow but potentially achieve a soft landing.
Considering these macroeconomic factors, the South Bend-Mishawaka MSA may see its unemployment rate rise to a range of 4.5% to 5.0% in 2024. Historically, this region tends to have an unemployment rate above the national average. In September 2023, Federal Reserve policymakers projected a median U.S. unemployment rate of 4.1% in 2024, with a central tendency of 3.9% to 4.4%.12 Encouragingly, the Indiana Business Research Center predicts an increase in income for South Bend-Mishawaka in 2024.13 However, the region's higher share of manufacturing employment (10.9% of total nonfarm employment from January to August compared to the national average of 8.4%) could push the local unemployment rate above the national average during economic contractions.
The housing market in St. Joseph County is expected to remain constrained in 2024 due to elevated housing prices and mortgage rates. The median sales price for existing homes reached $225,000 in August 2023, marking a regional high. According to Freddie Mac's Primary Mortgage Market Survey, the average 30-year fixed mortgage rate in the U.S. stands at approximately 7.57%, the highest since 2001.14 Many households secured lower mortgage rates before or during the pandemic. Now, surging housing prices and mortgage rates have significantly raised the cost of financing, discouraging many households from entering the housing market. In 2024, we can anticipate fewer listings and closed sales; nevertheless, the housing price may continue to rise at a more subdued pace, given the ongoing upward trajectory of the price level and expected growth in household income.
The Elkhart-Goshen MSA may experience a rise in unemployment rates ranging from 5.0% to 5.5% in 2024. A slim majority of the local workforce is employed in the manufacturing sector, closely tied to the RV industry's fortunes. High price levels may strain household budgets, while elevated interest rates will increase financing costs, both of which will weaken the demand for RVs. Data from the RV Industry Association report shows a substantial decline in total RV shipments, which totaled 213,421 units during the first eight months of 2023, marking a 45.0% decrease from 2022.15 The downward trend in RV shipments may persist into the fourth quarter of 2023. However, RV sales are projected to rebound in 2024, with wholesale RV shipments estimated to range between 363,700 and 375,700 units, and a median projection of 369,700 units, according to the RV RoadSigns Quarterly Forecast in September 2023.16 Although sales are predicted to rise in 2024, they are expected to remain below the high levels observed between 2019 and 2022, which could have a negative impact on labor market employment in the MSA.
Notes
- The labor statistics used in this article (including labor force, employment, unemployment, unemployment rate and employment and earnings by industries) are averages of data from January to August 2023. August 2023 data are preliminary.
- Labor force and employment data are available on STATS Indiana: https://www.stats.indiana.edu/laus/laus_view3.html.
- The average January-to-August labor force in the South Bend-Mishawaka MSA was 156,714 in 2023 and 156,025 in 2022. The average January-to-August labor force in the Elkhart-Goshen MSA was 116,091 in 2023 and 119,723 in 2022.
- The average labor force between January and August of 2019 was 163,656 for the South Bend-Mishawaka MSA and 114,079 for the Elkhart-Goshen MSA.
- The average unemployment rate for the South Bend-Mishawaka MSA was 3.7% in 2022 and 3.8% in 2019.
- The average unemployment rate for the Elkhart-Goshen MSA was 2.4% in 2022 and 3.2% in 2019.
- Total nonfarm employment and sectoral employment come from the Current Employment Statistics (CES) of the U.S. Bureau of Labor Statistics. https://www.stats.indiana.edu/ces/ces_naics/
- In 2022, the average January-to-August total nonfarm employment was 136,638 for the South Bend-Mishawaka MSA.
- Elkhart-Goshen MSA's total nonfarm employment averaged 146,650 in 2022 and 137,975 in 2019.
- “Local Market Update for August 2023, St. Joseph County,” Indiana Association of Realtors, September 19, 2023.
- “NABE panelists slightly more optimistic in October; majority put odds of recession at less than 50 percent,” National Association for Business Economics, October 2023, https://nabe.com/NABE/Surveys/Outlook_Surveys/October_2023_Outlook_Survey_Summary.aspx, retrieved on October 19, 2023.
- “Summary of Economic Projections,” Federal Open Market Committee, September 2023, https://www.federalreserve.gov/monetarypolicy/files/fomcprojtabl20230920.pdf, retrieved on October 19, 2023.
- “Indiana Metro Forecast Summary,” Indiana University Center for Econometric Model Research, October 2023, https://ibrc.kelley.iu.edu/analysis/cemr/msa-summary.html, retrieved on October 19, 2023.
- “Primary Mortgage Market Survey,” Freddie Mac, October 12, 2023, https://www.freddiemac.com/pmms, retrieved on October 19, 2023.
- “Monthly Shipment Report,” RV Industry Association, August 2023, https://www.rvia.org/news-insights/august-shipment-report-now-available, retrieved on October 19, 2023.
- “RV RoadSigns Quarterly Forecast,” RV Industry Association, September 2023, https://www.rvia.org/rv-roadsigns-quarterly-forecast, retrieved on October 19, 2023.


