Columbus forecast 2024

Assistant Professor of Management, Indiana University Division of Business, Columbus

Assistant Professor of Management, Indiana University Division of Business, Columbus

Associate Professor of Finance, Indiana University Division of Business, Columbus
The economic story of Columbus for the past 100 years has been one based in manufacturing. Since the early 1900s, Columbus has been a hub for manufacturing. This manufacturing base generated between 40% and 60% of the GDP for the Columbus Metropolitan Statistical Area (MSA) between 2001 and 2021. As a durable goods manufacturing-based economy, the Columbus MSA experienced significant economic volatility due to global supply chain issues and fluctuations in consumer spending related to the pandemic. Columbus concluded 2022 with lower annual average unemployment than 2021. During 2023, the unemployment rate moved to 3.0% or higher during five of the first eight months. Current expectations are for local economic output to increase during 2023 in light of vehicle production and sales projections. This article explores the 2023 data, as well as what is anticipated for 2024. We will begin our exploration of Columbus’ economic activity by focusing on one of our manufacturing keystones, Cummins.
Cummins
Cummins Inc. is an integral part of the Columbus economy, and materially contributes to its vibrancy in terms of output and employment. To analyze the 2024 outlook for Cummins Inc. and its impact on the local Columbus economy in 2024, we begin with a review of recent, relevant Cummins history.1
Key activities and positioning
Acquisitions: Cummins acquired three firms to bolster readiness for future power systems competition, including: (1) Jacobs Vehicle Systems (JVS), a supplier of technologies relevant to reductions of emissions for internal combustion power systems; (2) Meritor, Inc., a supplier of various technologies pertinent to internal combustion and electric powertrain systems; and (3) Siemens’ Commercial Vehicles business, bringing a family of heavy-duty electric drive systems to Cummins.
Divisions and areas of expertise: In 2022, Cummins earned sales revenue from five key segments, including Engine (31% of net sales), Components (28%), Distribution (26%) and Power Systems (14%). New Power Systems is an emerging segment of Cummins (less than 1% of net sales) that remains in its early phases of development. Cummins publicized plans to separate Filtration from its Components segment in 2021.
Key financial results for 2022 and 2023
Dividends: In 2022, Cummins increased its dividend per common share of equity for the 13th consecutive year, up to $1.57 per common share. Dividends were increased again in 2023 to $1.68 per common share of equity.2
Sales growth: Sales increased in 2022 to $28.074 billion, an increase of 16.9% from 2021. Through September 30, 2023, Cummins’ net sales totaled $25.522 billion, while fourth quarter 2022 net sales totaled $7.8 billion, for a total 12 months’ revenue of more than $33 billion. Even with headwinds, Cummins looks poised to post record sales in 2023.3
Earnings: In 2022, Cummins’ GAAP net income (“earnings”) was reported to be $2.151 billion. Earnings for the fourth quarter of 2022 totaled $631 million, and earnings from the first nine months of 2023 totaled $2.166 billion. Therefore, the last 12 months for Cummins Inc. produced earnings of $2.797 billion, which surpassed market expectations as well as last year’s earnings expectations.4
Leverage: During 2023, Cummins has improved the health of its balance sheet by reducing its Total Debt/Equity ratio from 2.01 to 1.75. This change was primarily due to an increase in reinvested earnings of $1.483 billion – an incredibly healthy sign even as the dividend simultaneously increased.5
Cummins outlook 2024
During the final part of 2023 and in 2024, we expect Cummins to begin to face cyclical challenges resulting in softening sales and earnings. However, any slowdown is expected to be modest, and Cummins has positioned itself financially on solid ground to withstand any slow period. Further, Cummins continues to actively seek acquisitions of future-oriented technologies within the power industry and is perceived at all levels of the marketplace as a leader among the world’s providers of engines and commercial-grade power systems.
We do not expect the Columbus economy to be adversely affected by any changes to Cummins Inc. sales, earnings and employment during 2024.
Status of supply chain
Global supply chains: According to a 2023 survey of 750 senior procurement leaders from large companies (>$500 million annual revenue) in North America and Europe, the cost of supply chain disruptions dropped by approximately 55% between 2022 and 2023. The average survey respondent in 2022 estimated the cost of their company’s supply chain disruptions at $182 million USD compared to the average 2023 respondent who estimated their cost at $82 million. This reduction was largely attributed to the disruptive effects of the COVID-19 pandemic subsiding.6
Despite this post-pandemic recovery, the senior procurement leaders surveyed still reported numerous other supply chain concerns. One leader from the U.S. Aerospace and Defense sector stated, “The magnitude of supply chain risk is higher than ever before.”7
The supply chain risks most frequently cited by the senior procurement leaders included:
-
The war in Ukraine
-
Geopolitical tensions involving the United States, China and Taiwan
-
Increasing sanctions and export controls, particularly toward China
-
Cost of energy
-
Cyber attacks
-
Bank collapses in the U.S. and Europe
-
Natural disasters
To deal with these risks, many procurement leaders reported they were in the process of restructuring their global supply chains to rely more heavily on regional and/or domestic suppliers and operations.
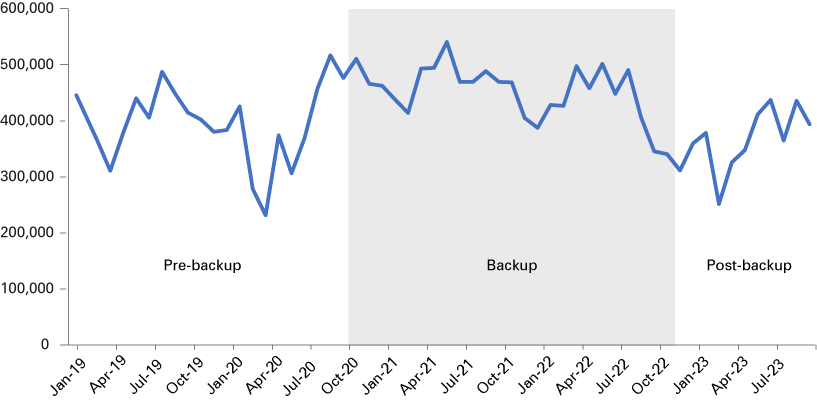
Transportation: Port backup resolved: The Port of Los Angeles has been ranked as the No. 1 port in the Western Hemisphere for 23 consecutive years (2000 - 2022). During the COVID-19 pandemic, the Port of Los Angeles, along with many other West Coast ports, suffered long wait times as cargo container ships backed up off the coast awaiting their turn to unload. At its peak on January 9, 2022, there were 109 container ships waiting off the coast to be unloaded at the Port of Los Angeles.8 The backups at these ports caused delays, which contributed to the supply chain disruptions across the United States throughout the pandemic.
From January 2019 through September 2020 (the beginning of the backups), the Port of Los Angeles offloaded an average of 395,270 Twenty-Foot Equivalent Units (TEUs) per month. During the backup (October 2020 to November 2022), the port was offloading an average of 447,499 TEUs per month (see Figure 1). During this time, some ships began sailing to the East Coast to offload their cargo where the backups were shorter than on the West Coast. The additional delays in sailing to the East Coast to unload also contributed to supply chain disruption.
Figure 1: Monthly imported TEUs at the Port of Los Angeles
Source: Port of Los Angeles annual container statistics9
On November 23, 2022, the Maritime Exchange of Southern California issued a statement claiming that after 25 months, the containership backup at the Ports of Los Angeles and Long Beach had ended.
Transportation: Truck driver shortage resolved: There are conflicting news stories about the status of the “driver shortage” within the trucking industry. For example, in October 2023, CBS News reported, “New study shows U.S. is facing truck driver shortage.”10 That news story was based on an August 2023 article in a transportation industry publication, which quoted an uncited “recent study” claiming, “More than 80,000 drivers are needed to make up a shortage in America this year.”11
However, a September 2023 article in Time claimed, “Demand for truck drivers has plummeted in the last year, and tens of thousands of drivers who entered the profession thinking it was a surefire way to earn a living are ending up deep in debt with no work.”12
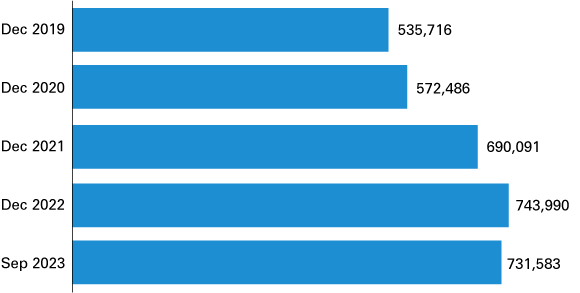
Data from the U.S. Department of Transportation shows that between December 2020 and September 2023, the number of drivers in the United States holding a Commercial Driver’s License (CDL) increased by 11.6% from 8.05 million to 8.98 million and the number of commercial interstate freight carriers increased by 27.8% from 572,486 to 731,583 (see Figure 2).13
Figure 2: Commercial interstate freight carriers in the United States
Source: Federal Motor Carrier Safety Administration custom report
In Indiana, the increase in commercial interstate freight carriers was even more dramatic, increasing by 31.2% from 14,505 in December 2020 to 19,025 in September 2023. During that same time, the number of Indiana drivers holding a CDL increased by 6.9% from 207,957 to 222,305.
Key measures
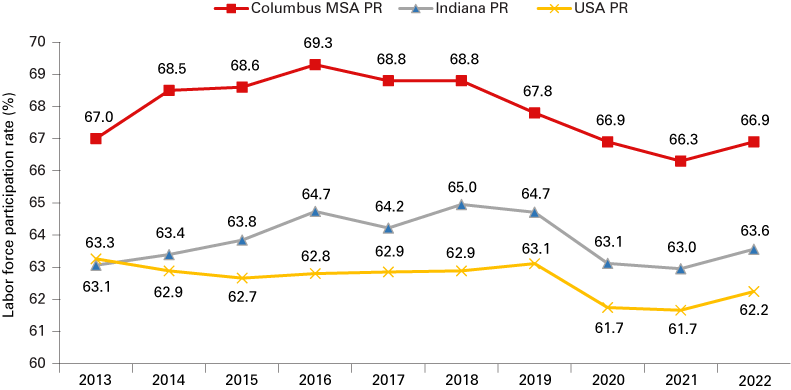
Employment and labor force: From 2010 to 2022, the Columbus MSA experienced an overall increase in average annual labor force and employment, experiencing a growth of 5,953 people in the labor force and 8,471 in increased employment, even with the steep decline of 3,187 in employment in 2020. The number of employed people increased by 825 in 2021 and 1,437 in 2022, followed by a decline of 864 in employment in the first nine months of 2023.14 Concerning for firms, the labor force participation rate remains high while the labor force declined by more than 500 people year-over-year in September 2023.
Figure 3: Labor force participation rate
Note: Data for Columbus MSA are not seasonally adjusted. Data for Indiana and the U.S. are seasonally adjusted.
Source: Local Area Unemployment Statistics (LAUS), U.S. Bureau of Labor Statistics and the American Community Survey, 1-year estimates from the U.S. Census Bureau
Unemployment: As the nation recovered from pandemic-created economic disruption, the unemployment rate for Columbus returned to 2.8% in September 2023 (not seasonally adjusted) after peaking at 17.4% in April 2020.15 The Columbus MSA September unemployment rate is equal to or slightly lower than any of the metros and micros contiguous to Bartholomew County, except the Cincinnati area (see Table 1).
Table 1: September unemployment rate comparison for selected Indiana metros and micros
| 2017 | 2018 | 2019 | 2020 | 2021 | 2022 | 2023 | |
|---|---|---|---|---|---|---|---|
| U.S. | 4.1% | 3.6% | 3.3% | 7.7% | 4.6% | 3.3% | 3.6% |
| Indiana | 3.2% | 2.9% | 2.7% | 6.1% | 3.2% | 2.5% | 3.3% |
| Bloomington | 3.2% | 2.9% | 2.6% | 5.0% | 2.6% | 2.2% | 3.1% |
| Cincinnati* | 2.6% | 2.6% | 2.4% | 4.7% | 2.5% | 2.0% | 2.7% |
| Columbus | 2.4% | 2.1% | 2.0% | 5.1% | 2.5% | 1.9% | 2.8% |
| Evansville | 2.8% | 2.7% | 2.5% | 5.6% | 3.1% | 2.4% | 3.2% |
| Greensburg | 3.6% | 3.1% | 3.0% | 5.3% | 2.6% | 2.1% | 3.2% |
| Indy-Carmel-Anderson | 3.1% | 2.8% | 2.5% | 6.3% | 3.1% | 2.3% | 3.1% |
| Kokomo | 3.3% | 3.1% | 3.2% | 7.9% | 6.6% | 4.2% | 4.4% |
| Louisville* | 3.2% | 3.1% | 2.7% | 5.7% | 2.7% | 2.2% | 3.1% |
| North Vernon | 3.2% | 2.9% | 2.4% | 5.2% | 3.1% | 2.6% | 3.2% |
| Seymour | 2.7% | 2.5% | 2.2% | 4.8% | 2.7% | 2.2% | 2.8% |
* Only the Indiana portion of the metro is included.
Note: Data are not seasonally adjusted. Red cells indicate the highest rate and green cells indicate the lowest rate for each year.
Source: STATS Indiana, using Local Area Unemployment Statistics (LAUS) data from the U.S. Bureau of Labor Statistics
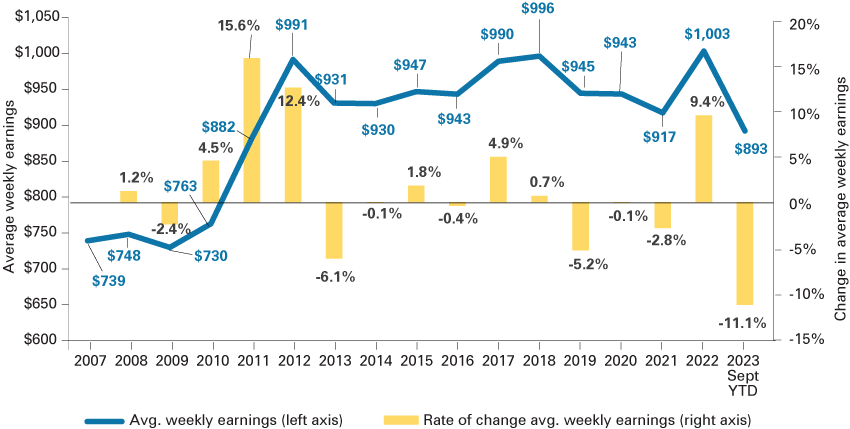
Weekly earnings: Average weekly earnings for the Columbus MSA experienced impressive 36% growth from a low of $730 in 2009 to $996 in 2018 (not seasonally adjusted annual averages).16 However, average weekly earnings then declined for three consecutive years. A turnaround was noted in 2022 followed by a 12% decline in the first nine months of 2023 due to a decrease in weekly hours. Figure 4 shows the average weekly earnings data since 2007.
Figure 4: Total private average weekly earnings in the Columbus MSA
Note: Data are not seasonally adjusted. 2023 data is shown through September 2023.
Source: Current Employment Statistics (CES), U.S. Bureau of Labor Statistics and Indiana Department of Workforce Development
Economic indicators
Vehicle sales and production: Light vehicle sales in the United States peaked in 2016, with approximately 17.5 million units sold.17 Moving forward from 2016, we generally saw declines each year to 2020, when less than 14.5 million units were sold. In 2022, sales dropped to about 13.7 million units as interest rate increases chilled demand for durable goods including vehicles. In 2023, sales picked up and year-end numbers appear to be poised to eclipse 14 million units.18
Electric vehicles (EVs): Important to the Columbus-area economy is an understanding of the changing nature of automotive parts that will be in demand in future years. While 2024 looks to be relatively stable, the rate of EVs sold as a share of total light vehicles sold is rising at an incredible rate.19 EVs are expected to comprise over one million units in total sales for the first time ever, out of just over 14 million total units sold in the U.S. EV sales have now increased for 13 consecutive quarters, even as vehicle sales overall have been in total decline during that same three-year period.
Negative impact on the local economy: The consequence of this switch to EVs on the outlook for the job market in the Columbus MSA is negative. Columbus and its relevant productive market area include producers of components of piston engines, transmissions and related parts, and these firms will be in decline, presenting a downward pressure on economic output and upward pressure on local unemployment for 2024 and the following decade, as the world transitions from internal combustion engine vehicles to EVs.
Local building permits and residential housing sales: Building permits growth rate is a leading indicator of economic activity. Following a recovery in the number of building permits in 2020 and 2021 (see Figure 5), building permits declined in 2022 then further accelerated downward in 2023 to a level reflecting the low in 2019. Interest rates continue to rise at a rate not seen since 1980 and the cost of construction continues at elevated levels. Residential housing sales for the first nine months of the year declined from a high of 1,045 units in 2018 to 747 units in 2023, well below the prior low in 2019 (844 units). The lack of available and affordable new and existing housing in the Columbus MSA may continue as a drag on economic growth in the near term.
Figure 5: Local fiscal year building permit trends for the Columbus MSA
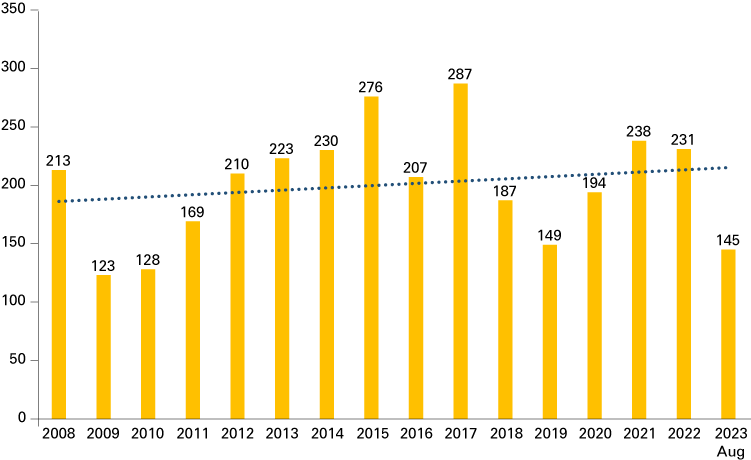
Note: The fiscal year is October to September. Data for 2023 is only available to August.
Source: U.S Census Bureau
Local real GDP growth: From 2017 to 2020, Columbus chained GDP decreased by 0.7%. This period includes a 7.8% rebound in 2018 (see Figure 6), before declining again in 2019 and 2020. Columbus GDP in 2021, the most recent data available, rebounded by 8.5%, returning to 2018 levels. The rebound is due to a strong 15% rebound in manufacturing activity between 2020 and 2021, reflective of 2014 levels. Table 2 reflects the GDP change for the nation and several Indiana metros. Only Bloomington, Columbus and Kokomo experienced GDP declines in both 2019 and 2020. The Columbus and Kokomo GDP fluctuations reflect the cyclical nature of a manufacturing/durable goods-based economy.
Figure 6: Year-over-year chained GDP growth
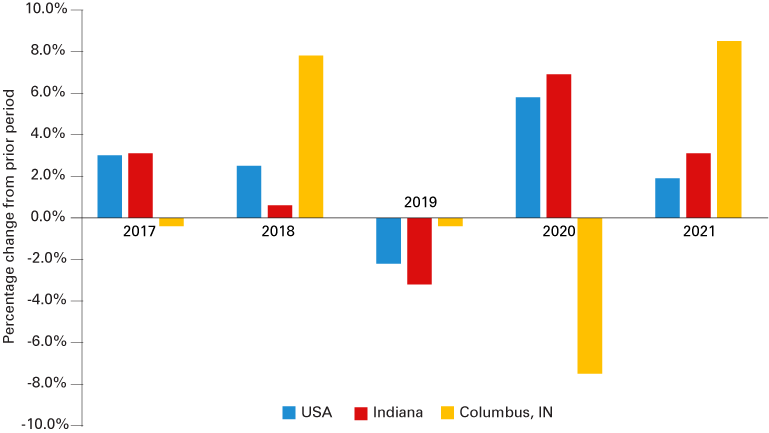
Source: U.S. Bureau of Economic Analysis, chained GDP
Table 2: Annual GDP growth rate comparison for selected metros
| 2017 | 2018 | 2019 | 2020 | 2021 | 10-year average | 3-year average | |
|---|---|---|---|---|---|---|---|
| U.S. | 3.0 | 2.5 | -2.2 | 5.8 | 1.9 | 2.2 | 1.8 |
| Indiana | 3.1 | 0.6 | -3.2 | 6.9 | 3.1 | 1.7 | 2.3 |
| Bloomington, IN | 4.3 | 3.3 | -0.4 | -3.6 | 3.7 | 1.6 | -0.1 |
| Cincinnati, OH | 2.2 | 0.6 | 4.9 | -2.3 | 6.0 | 2.2 | 2.9 |
| Columbus, IN | -0.4 | 7.8 | -0.4 | -7.5 | 8.5 | 1.3 | 0.2 |
| Evansville, IN | 6.1 | 4.5 | 4.3 | -4.2 | 3.3 | 0.8 | 1.1 |
| Indianapolis-Carmel-Anderson, IN | 0.8 | 4.2 | 2.7 | -1.8 | 5.0 | 1.5 | 2.0 |
| Kokomo, IN | -2.7 | 2.0 | -0.1 | -4.8 | 10.5 | -0.3 | 1.9 |
| Louisville, KY | 0.8 | 1.5 | 3.1 | -1.9 | 5.9 | 1.8 | 2.4 |
Note: Shaded cells indicate declines.
Source: U.S. Bureau of Economic Analysis, chained GDP
Outlook
Upside potential
-
New orders for manufactured durable goods increased five of the past nine months and remain above pre-pandemic levels.20
-
“Buy America” elements within the Inflation Reduction Act of 2022 may create additional opportunities for existing automotive suppliers who produce parts for electric vehicles and those same incentives are expected to attract new investments by battery manufacturers throughout the U.S.
-
Cummins is positioned to enjoy another year of sales growth, much of which will be driven by inflation, yet the company should be able to preserve profit margins and EBITDA, surpassing 2022 levels. Of course, this is contingent on the economy not landing too hard given the aggressiveness of the Federal Reserve’s fight against inflation. Employment appears to be stable and economic growth seems likely, although there are obviously risks.
Downside potential
-
Personal consumption may be constrained in 2024 as the U.S. savings rate returned to financial crisis (Great Recession) levels,21 student loan payments restarted in October 2023 and consumers react to rising interest rates associated with Federal Reserve actions during 2022 and 2023.
-
Residential housing sales and building permits may decline further in 2023 and 2024, as higher interest rates and higher prices begin to decrease demand and affordability.
-
Local GDP growth may be hindered by a lack of available workers if unemployment rates remain low and the number of unfilled jobs remains high.22 Continuing the sentiment from the previous forecasts, Columbus continues to have a high rate of labor force participation (67%), relatively low unemployment and competitive weekly earnings, which may limit employers’ ability to expand their workforce.
Forecast
Based on the above review of economic data, Columbus may experience declining real GDP between 2.0% and 5.0%, similar to the 2013-2016 time period. Weakness in the automotive and durable goods sector, fueled by continued supply chain issues and high interest rates, combined with declining consumer confidence, would be key to this scenario.
Unemployment may increase to between 4.0% and 5.0% in 2024 due to slack in the manufacturing sector and the addition of up to 1,500 new entrants into the job market. In this scenario, the number of employed is expected to decrease by between 0 and 1,000 in 2024. We expect this economic weakening to materialize in the first half of 2024.
Notes
- “Cummins Inc. Form 10-K.” Cummins Inc. December 31, 2022. Retrieved on November 9, 2023 from https://investor.cummins.com/sec-filings/annual-reports/content/0000026172-23-000005/0000026172-23-000005.pdf.
- “Cummins Inc. Form 10-Q.” Cummins Inc. September 30, 2023. Retrieved on November 9, 2023 from https://investor.cummins.com/sec-filings/annual-reports/content/0000026172-23-000045/0000026172-23-000045.pdf.
- “Cummins reports strong fourth quarter and full year 2022 results.” Cummins Inc. February 6, 2023. Retrieved on November 9, 2023 from https://investor.cummins.com/news/detail/592/cummins-reports-strong-fourth-quarter-and-full-year-2022.
- “Cummins (CMI) Q3 earnings & sales top estimates, rise Y/Y.” Zacks Equity Research. November 2, 2023. Retrieved on November 9, 2023 from https://www.nasdaq.com/articles/cummins-cmi-q3-earnings-sales-top-estimates-rise-y-y#:~:text=Cummins%20Inc.,expected%20revenues%20across%20all%20segments.
- Authors’ calculations using key balance sheets data taken from the Cummins Inc. 10-Q posted on November 2, 2023.
- “Invisible Threats: Resilience 2023.” Interos. August 9, 2023. Retrieved October 12, 2023 from https://www.interos.ai/resources/supply-chain-survey-2023/.
- Ibid.
- Schuler, Mike. “Southern California containership backup cleared.” gCaptain, November 23, 2022. Retrieved on October 14, 2023 from https://gcaptain.com/southern-california-containership-backup-cleared/.
- “Annual container statistics.” The Port of Los Angeles. Retrieved October 19, 2023 from https://www.portoflosangeles.org/business/statistics/container-statistics.
- Downs, Brandon. “New study shows U.S. is facing truck driver shortage.” CBS Sacramento. Retrieved October 26, 2023 from https://www.msn.com/en-us/news/us/new-study-shows-u-s-is-facing-truck-driver-shortage/ar-AA1iUefV.
- “The truck driver shortage in the U.S. continues.” American Journal of Transportation. August 3, 2023. Retrieved October 26, 2023 from https://www.ajot.com/news/the-truck-driver-shortage-in-the-us-continues#.
- Semuels, Alana. “The trucking bubble has burst.” Time, September 13, 2023. Retrieved October 26, 2023 from https://time.com/6313178/trucking-bubble-has-burst/.
- Federal Motor Carrier Safety Administration custom report. Retrieved October 26, 2023 from https://ai.fmcsa.dot.gov/RegistrationStatistics/CustomReports.
- U.S. Bureau of Labor Statistics, Local Area Unemployment Statistics (LAUS), not seasonally adjusted. Retrieved November 1, 2023 from STATS Indiana website: http://www.stats.indiana.edu/laus/laus_view3.html.
- Ibid.
- U.S. Bureau of Labor Statistics, Current Employment Statistics (CES), not seasonally adjusted, and Indiana Department of Workforce Development data. Retrieved from STATS Indiana website: https://www.stats.indiana.edu/ces/ces_naics/.
- Carlier, Mathilde. “Light vehicle retail sales in the United States from 1976 to 2022.” Ward’s reported by Statista, August 24, 2023. Retrieved on November 3, 2023 from https://www.statista.com/statistics/199983/us-vehicle-sales-since-1951/.
- “Flash report, October 2023.” Automotive Industry Portal, November 2, 2023. Retrieved on November 3, 2023 from https://www.marklines.com/en/statistics/flash_sales/automotive-sales-in-usa-by-month.
- “Another quarter, another record: EV sales in the U.S. surpass 300,000 in Q3, as Tesla share of EV segment tumbles to 50%.” Cox Automotive, October 12, 2023. Retrieved on November 3, 2023 from https://www.coxautoinc.com/market-insights/q3-2023-ev-sales/.
- “Monthly advance report on durable goods manufacturers’ shipments, inventories and orders, September 2023.” U.S. Census Bureau. Retrieved October 30, 2023 from https://www.census.gov/manufacturing/m3/adv/current/index.html.
- “Personal Saving Rate [PSAVERT].” U.S. Bureau of Economic Analysis. Retrieved October 22, 2023, from FRED, Federal Reserve Bank of St. Louis, https://fred.stlouisfed.org/series/PSAVERT.
- “Number of unemployed persons per job opening, seasonally adjusted.” U.S. Bureau of Labor Statistics. Retrieved October 23, 2023 from https://www.bls.gov/charts/job-openings-and-labor-turnover/unemp-per-job-opening.htm.


