

U.S. outlook for 2024

Associate Professor Emeritus, Department of Economics, Indiana University Bloomington
In what follows, we will cover three topics: (1) a review of the past year relative to the 2023 outlook we presented a year ago, (2) our new forecast for 2024 and (3) discussion of potential risks to that forecast.
When the Futurecast panel toured the state in November, we had data through the third quarter of the year. When we refer to the past year in what follows, we will mean the four quarters from 2022 Q4 through 2023 Q3. In Table 1, the first column presents data for that period. Our current outlook is for 2024, but it also includes the final quarter of 2023. Below, we divide these five forecast quarters between the first three (column two in Table 1) and the final two (column three).
The past year
A year ago, we were decidedly wishy-washy in our expectations for 2023. Instead of boldly giving a specific view, we presented two alternatives that we thought would bracket the likely potential outcomes – one dubbed “optimistic,” the other “pessimistic.”
In retrospect, this was a shrewd dodge. If we had presented a single outlook, it would probably have been toward the pessimistic end of our range. But, in fact, the actual outcome over the past year has greatly exceeded our optimistic alternative. A year ago, we thought that growth below trend was an optimistic scenario. In fact, growth has been well above long-run potential (which we put at about 2%). As shown in Figure 1, over the past four quarters, actual growth in output (real GDP - shown by the solid red 2023 data line) has averaged 2.9% – far above the 1.1% in our forecast (shown by the dashed blue 2022 forecast line).
Figure 1: Annual rate of change in U.S. real GDP
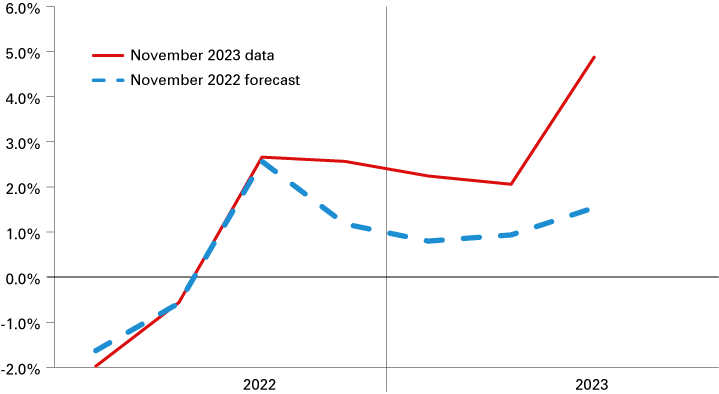
Source: U.S. Bureau of Economic Analysis data and author’s calculations for forecast
The labor market picture for the past year is similar. Job creation (see Figure 2) has averaged 270,000 per month, which very significantly exceeded our expectation of 140,000. Our year-ago outlook had the unemployment rate at 4.5% for 2023 Q3; the actual number came in at 3.7%, almost unchanged from a year earlier.
Figure 2: Monthly change in U.S. employment
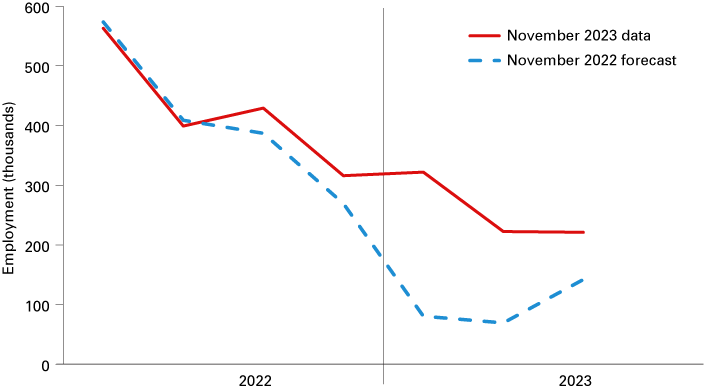
Source: U.S. Bureau of Labor Statistics data and author’s calculations for forecast
We concluded our discussion last year with four factors that we thought would be decisive for the upcoming year. The first was whether consumer spending would hold up. In fact, due to surges in the first and third quarters of 2023, consumption came in significantly higher than our “optimistic” scenario.
Our second concern was how conditions in the labor market would evolve. As covered above, the answer is “better than we expected.” This was due mostly to an increase in labor force participation that significantly exceeded our expectation.
Our third concern was that things in Ukraine might go from bad to worse. Instead, they have just remained bad.
Finally, we were concerned that problems would arise in the financial sector. To a certain degree, this has occurred. Three large regional banks experienced massive deposit runs and failed. The cryptocurrency sector has had several large bankruptcies. But nothing that occurred has spread into the broader financial system or the economy at large.
The next year
So, what is our Futurecast? Bottom line: We think the economy will slow somewhat in 2024, with modest deceleration in the first half of the year and then reacceleration in the second half.
Table 1: U.S. data and forecast
| 2022 Q4-2023 Q3 (data) |
2023 Q4-2024 Q2 (forecast) |
2024 Q3-2024 Q4 (forecast) |
|
|---|---|---|---|
| Real GDP growth (annual rate) | 2.9% | 1.6% | 1.8% |
| Core PCE inflation rate (annual rate) | 3.9% | 2.4% | 2.2% |
| Employment change (monthly average) | 270,000 | 61,000 | 50,000 |
| Unemployment rate (high quarter of period) | 3.7% | 4.2% | 4.3% |
| Real consumption growth (annual rate) | 2.4% | 1.5% | 2.0% |
Source: U.S. Bureau of Economic Analysis and U.S. Bureau of Labor Statistics for data; author’s calculations for forecast
To be more specific, as shown in row one of Table 1 and in Figure 3, during the final quarter of 2023 and the first two of 2024, we expect that output growth will slow to a 1.6% rate and then rise to a 1.8% rate in the final two quarters of 2024. The low point is 1.2% growth in 2024 Q2. Inflation, shown in row two of Table 1, declines steadily in our forecast. As measured by the core personal consumption expenditures (PCE) price index – the preferred measure of the Federal Reserve – from an average of 3.9% over the past year, we have inflation falling to just 2.2% in the second half of 2024.
Figure 3: Forecast for annual rate of change in U.S. real GDP
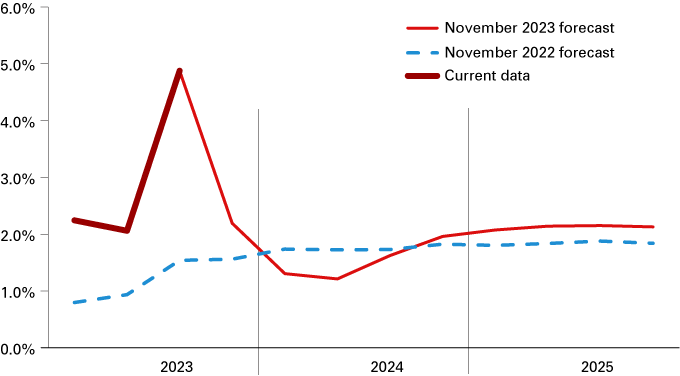
Source: U.S. Bureau of Economic Analysis data and author’s calculations
The pattern for job creation, shown in Figure 4 and row three of Table 1, is qualitatively like that for output. The low point for employment is 2024 Q2 with an increase of just 14,000 jobs. The unemployment rate (Table 1, row four) peaks a quarter later at 4.3%.
Figure 4: Forecast for monthly change in U.S. employment
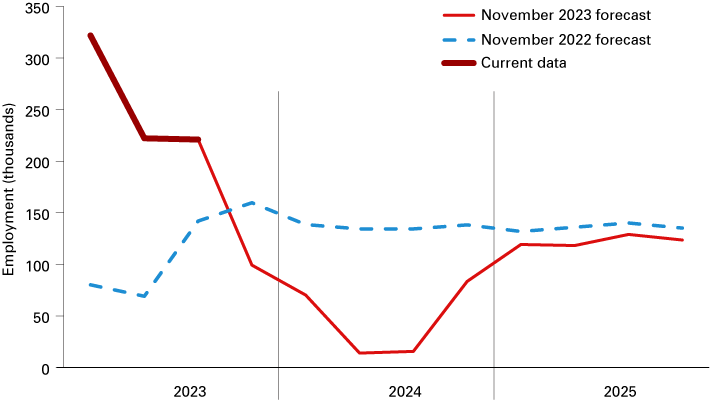
Source: U.S. Bureau of Labor Statistics data and author’s calculations
Risks to the outlook
Subjectively, our outlook seems optimistic to us, and we have a lot of concerns. Our short list of worries for the upcoming year is nearly the same as a year ago: the labor market, potential financial sector problems, consumer behavior and political problems.
Starting with the labor market, the basic facts of the situation are quite simple: the U.S. economy has a significant excess demand for labor. At current wage rates, there is more demand (that is, unfilled jobs) than there are available workers (that is, those looking for jobs). Specifically, in September of 2023, the U.S. Bureau of Labor Statistics estimated the country had 9.6 million job openings against just 6.4 million unemployed workers – an excess demand of 3.2 million.1 Basic Econ 101 theory says that in this market situation, the level of the quantity variable (here, the level of employment) is determined by changes on the supply side of the market. Essentially, you can’t hire workers who aren’t available. But most analyses of employment in the media are in terms of demand for labor. When employment rises, we are told that this is troubling because rising demand for labor may put upward pressure on wages and hence hamper the Fed’s fight against inflation. This is nonsense if the movement is coming from higher supply.
Over the past year, the U.S. labor force has been expanding about twice as fast as the working-age population, meaning that people who were non-workers are now seeking (and, in many cases, finding) work. Looking to the next year, we think that this labor force expansion will lose steam leading to a significant drop-off in employment growth. If this is not the case – if, as in the past year, labor force participation continues to rise – it will be positive for the economy.
Turning to the financial sector, we see problems in both the short run and longer term. Our forecast assumes that the Fed has finished raising the federal funds rate, but will not begin lowering it until well into 2024. Further, we think rates from 10-years and out, which rose significantly during October, are likely to move still higher during next year. In the short run, this will undoubtedly put pressures on the financial system, as firms are forced to refinance debts – in many cases, excessive debts – taken on during the low-rate period. The possibility that things could break is clear. Less obvious is how severe the breakage will be and where it will show up.
From a longer term perspective, the move to higher rates can be viewed as a desirable adjustment after a decade of abnormal (and counter-productive), near-zero interest rates. The real long-term financial problem is the totally unsustainable fiscal situation of the federal government. Over the four decades prior to 2020, the federal deficit averaged 3.3% of GDP. For 2023, that value will be about 5.9%. Based on Congressional Budget Office projections, it will rise steadily over the next decade to 7.3% in 2033. The longer we wait to confront this situation, the more difficult any solution will become. But, sadly, our expectation is that we will wait at least another year.
The behavior of domestic U.S. consumption (as mentioned above and shown in Table 1, row five) has been strong – growing at a 2.4% rate during the past year – above our optimistic scenario of a year ago. We expect that growth to moderate through the first half of 2024, with growth dropping to a 1.5% rate. But that expectation comes with significant trepidations. One is the state of households’ finances. During the pandemic, this situation improved dramatically as households received large government transfer payments, a significant part of which were saved. But over the past two years, some of that “excess” saving has been spent. A question for next year is how much remains.
Other questions surround the ending of other pandemic programs that have been supporting the budgetary situation of households. Two of these are the terminations of forbearance on student debt payments and of government assistance for child care expenses. Both will eat into households’ income. On the other hand, the strong labor market has been a solid support for household income. Another, often ignored, positive factor is the impact of rising interest rates on the income earned on household savings, especially for the ever-growing elderly demographic. A final issue worth mention is that there is a wide degree of demographic disparity in pressures on household budgets.
Even if income holds up, however, households may not continue to spend. Consumer sentiment has declined in the past couple of months. Weakness in the labor market or problems in the financial markets would likely be a problem for consumer confidence. Continuing inflation could be another negative. Higher interest rates, for example on auto loans and credit card debt, could be another impediment to consumer spending.
Last, there are potential political problems – both domestic and international. Here, it is very hard to be hopeful. Indeed, as I write this in late October, the situation in both realms seems to be deteriorating. I have been paying attention to these matters for over six decades, and I think now is the worst that things have been in that entire period.
Conclusion
To sum up: Our economic outlook for the national economy during 2024 is relatively optimistic. We expect growth in output and employment to slow, with recovery later in the year. We expect disinflation to continue. But there are a lot of things that could go wrong.
Notes
- U.S. Bureau of Labor Statistics, Job Openings and Labor Turnover Survey – September 2023. https://www.bls.gov/news.release/pdf/jolts.pdf
