Evansville forecast 2024

Professor of Economics, University of Southern Indiana
Over the last year, uncertainty about inflation rose to unprecedented levels since the start of the COVID-19 pandemic and the divergence among professional forecasters regarding future inflation was much in evidence.1 Among much economic uncertainty, components such as labor market conditions, metrics of output and productivity indicators, inflation uncertainty emerged as the dominant source of our aggregate economic uncertainty, bookended by the Russian invasion of Ukraine.2 In 2023, inflation risks continued to impact the direction and level of economic activity at the local, regional and national levels in the U.S.
For the Evansville region, the 2023 forecasts for real output growth, nominal personal income growth and the unemployment rate were 2.5%, 6.9% and 2.7%, respectively.3 By the end of 2023, the actual results for each of these economic indicators are expected to deviate considerably from the forecasts. Regarding the employment level, however, it is anticipated that the actual outcome will not deviate considerably from the forecast for 2023.
Once all data are released for 2023, real output and nominal personal income growth rates are estimated to decrease by 0.6% and increase by 4.2%, respectively, from their 2022 levels.4 The unemployment rate in the Evansville metro increased from 2.9% in January 2023 to 3.2% in September 2023 (not seasonally adjusted), and is expected to be at 3.0% at the end of the year.5 The number of additional jobs estimated for 2023 is 1,749, which is relatively close to the forecast of 1,700. The increase in jobs occurred primarily in the following sectors: manufacturing, professional services, finance and insurance and accommodation and food services. The primary activities experiencing jobs losses were retail trade, information services and government.6
In 2024, the number of jobs is projected to increase by 1,280, nominal personal income growth is forecasted to increase by 4.3%, real output is expected to decrease by 0.25% and the unemployment rate is forecasted to be 3.6% (by 2024 Q3).
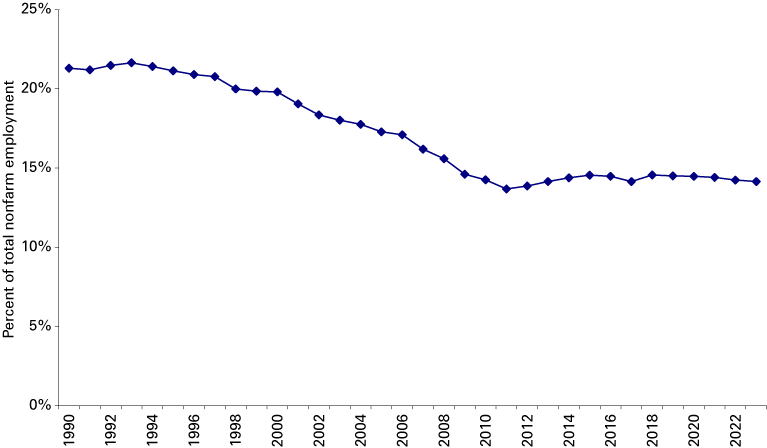
The manufacturing sector continues to be an important base to metro-area exports, as well as household incomes, and exhibits relative stability as a share of total employment over the past decade (see Figure 1).
Figure 1: Evansville metro manufacturing employment as a percent of total nonfarm employment

Note: Data are not seasonally adjusted. 2023 data are preliminary September data.
Source: STATS Indiana, using U.S. Bureau of Labor Statistics (Current Employment Statistics) and Indiana Department of Workforce Development data
As one of the most manufacturing-dependent metro areas in the nation, the Evansville economy continues to adjust to the impact of the Great Recession. While there is evidence of a COVID-19 impact, it appears to be much more transitory than the structural impacts of the Great Recession. Since 2007, Evansville’s manufacturing workforce has fallen by 10.6%, or about 2,700 workers, compared to a 1.9% reduction in Indiana’s manufacturing workforce over the same period. The manufacturing sector in the Evansville region accounts for about 18% of total annual wages, about 23% of real GDP, about 51% of exports and, as Table 1 shows, 14.2% of employment.7
Table 1: Manufacturing’s percent of total nonfarm employment, September 2023
| Evansville metro | Indiana | U.S. | |
|---|---|---|---|
| Manufacturing | 14.2% | 16.4% | 8.3% |
| Durables | 38.6% | 70.5% | 62.7% |
| Nondurables | 61.4% | 29.5% | 37.3% |
Note: Data are not seasonally adjusted. September 2023 data are preliminary.
Source: STATS Indiana, using U.S. Bureau of Labor Statistics (Current Employment Statistics) and Indiana Department of Workforce Development data
Given the proportion of output that is sold outside the metro area, the economic vitality in the Evansville area is linked to the strength of the broader economy. As demand for locally produced goods recovers and expands, so will income, output and employment in the Evansville region.
A discernible structural difference in manufacturing between the Evansville economy and the U.S. economy highlights a key aspect of the economic structure of the Evansville economy. While the manufacturing sector alone accounts for just over 50% of all exports from the Evansville region, the bulk of the manufacturing exports, about 67%, is accounted for by nondurable manufacturing. Nondurable manufacturing also accounts for about 66% of manufacturing output.
Given the relatively high share of nondurable manufacturing employment (as a percent of total manufacturing employment) and the role of the manufacturing sector as a significant driver of economic activity, the Evansville economy in 2024 will be shaped by labor market conditions, production conditions and inflation risks associated more with this segment of manufacturing than developments in the overall manufacturing sector. The nature of the adjustments by businesses to changes in unit labor costs, interest rates and consumer spending will be a key determinant of the economic performance of the Evansville region in 2024.
Notes
- Glick, Reuven and Noah Kouchekinia (2021). “Disagreement about U.S. and Euro-area inflation forecasts,” FRBSF Economic Letter 2021-08, March 22, 2021, https://www.frbsf.org/economic-research/publications/economic-letter/2021/march/disagreement-about-us-and-euro-area-inflation-forecasts/
- Londono, Juan M., Sai Ma and Beth Anne Wilson (2023). "Global inflation uncertainty and its economic effects," FEDS Notes. Washington: Board of Governors of the Federal Reserve System, September 25, 2023, https://doi.org/10.17016/2380-7172.3391
- Khayum, Mohammed (2022). “Evansville forecast 2023,” Indiana Business Review 97, no. 4, Winter 2022, https://www.ibrc.indiana.edu/ibr/2022/outlook/evansville.html
- Evansville forecast from the Indiana University Center for Econometric Model Research, October 2023.
- Unemployment rate data come from the U.S. Bureau of Labor Statistics, Local Area Unemployment Statistics (LAUS), not seasonally adjusted. Forecast comes from the Indiana University Center for Econometric Model Research, October 2023.
- Employment data come from Lightcast.
- Manufacturing annual wages, real GDP and exports data come from Lightcast. Manufacturing employment data come from the U.S. Bureau of Labor Statistics, Current Employment Statistics (not seasonally adjusted).


