Bloomington forecast 2024

Director and Executive Editor, Indiana Business Research Center, Indiana University Kelley School of Business
Recession or no recession? That was the question we posed last year and the answer was: maybe. Our forecast was split due to many factors, not the least of which were the residual effects of the pandemic shutdowns and slowdowns, supply chain bottlenecks and inflation rearing its generally ugly head. Both our forecast models (thanks to Bill Witte, as always), and general consensus among Kelley School economists, foretold a relatively brief recession or extremely slow and low growth. We know now, at least for the nation as a whole, that we did not experience any consecutive quarters of negative growth (as in, GDP shrinking rather than growing) during the first three quarters of 2023. In fact, many were startled by the 5% growth in GDP between the second and third quarters of 2023. So, what does the economy look like for Bloomington in 2024 and beyond? Let's look at the charts.
Employment
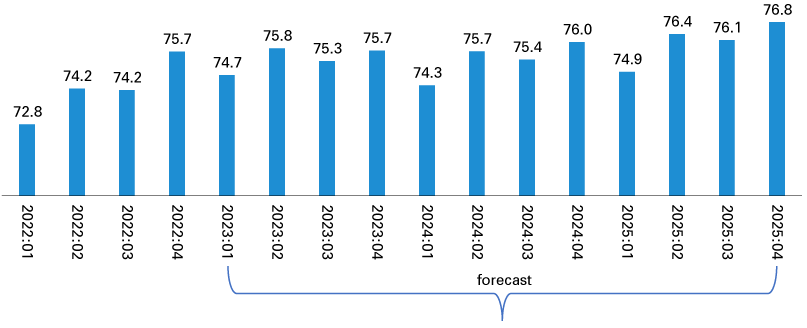
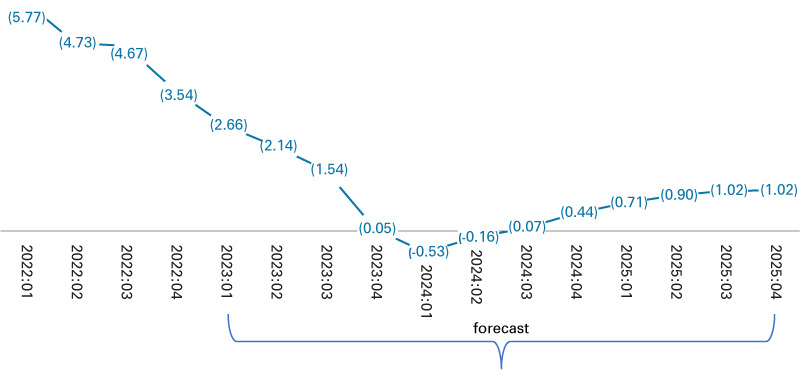
The Bloomington metropolitan area (Monroe and Owen counties) boasts a large number of jobs, as measured by payroll employment, that is expected to grow to nearly 80,000 by the last part of 2025 (see Figure 1). Year-to-year growth was most significant when Bloomington came out of the pandemic shutdowns that heavily affected hospitality and leisure businesses. The quarterly growth of jobs began to decelerate in the waning months of 2022 and our forecast models show a slight decline of less than 1% in the last months of 2023 and the early months of 2024 (see Figure 2). Growth will be small through the fall of 2025, which probably speaks directly to a net loss of jobs -- that is, we anticipate some businesses closing and others either not replacing positions, not hiring for new positions or a combination of both.
Figure 1: Bloomington MSA payroll employment (in thousands of persons)
Source: Indiana Business Research Center, Center for Econometric Model Research (CEMR) forecast models for 2024 Futurecast
Figure 2: Year-over-year change in Bloomington MSA payroll employment (%)
Source: Indiana Business Research Center, CEMR forecast models for 2024 Futurecast
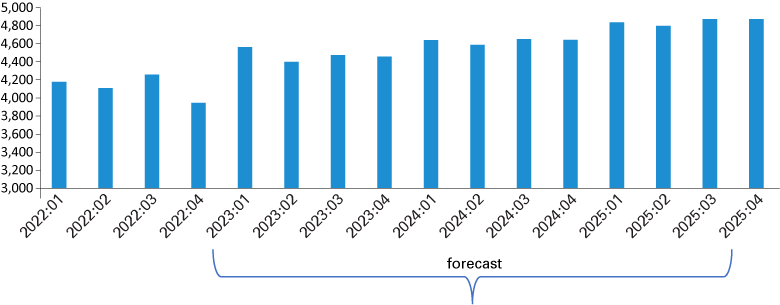
Figure 3: Bloomington MSA quarterly payroll volume (in millions of dollars)
Source: Indiana Business Research Center, CEMR forecast models for 2024 Futurecast
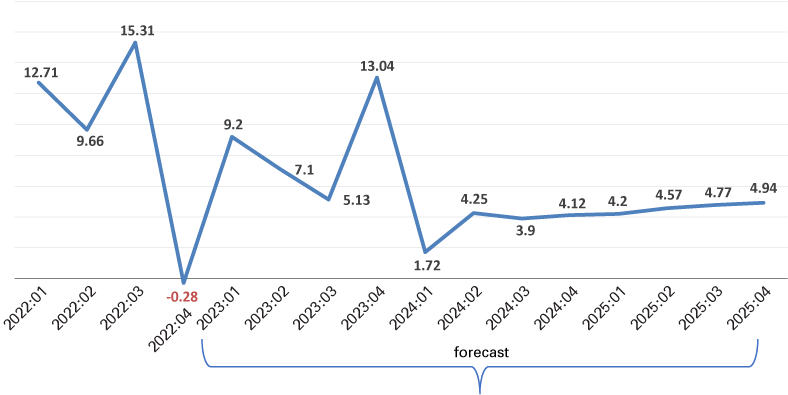
Figure 4: Year-over-year change in Bloomington MSA payroll volume (%)
Source: Indiana Business Research Center, CEMR forecast models for 2024 Futurecast
Labor force and unemployment
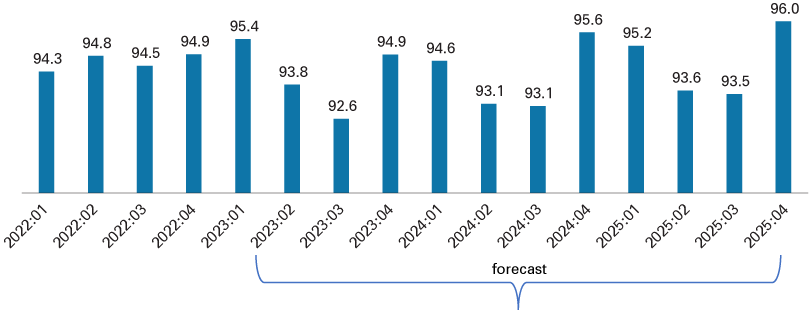
Figure 5: Size of the Bloomington MSA resident labor force (in thousands of persons)
Source: Indiana Business Research Center, CEMR forecast models for 2024 Futurecast
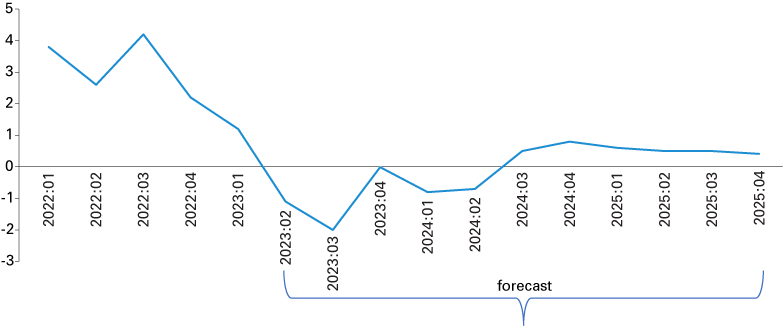
Figure 6: Year-over-year change in Bloomington MSA labor force (%)
Source: Indiana Business Research Center, CEMR forecast models for 2024 Futurecast
Table 1: Months with greatest unemployment between 1990 and 2023
| Year | Unemployed | Month where unemployment numbers 6,000 or more |
|
|---|---|---|---|
| 2009 | 6,418 | February | |
| 6,281 | June | ||
| 6,098 | July | ||
| 2010 | 6,906 | January | |
| 6,833 | February | ||
| 6,650 | March | ||
| 6,134 | April | ||
| 6,350 | May | ||
| 7,150 | June | ||
| 6,796 | July | ||
| 6,467 | August | ||
| 2011 | 6,162 | January | |
| 6,326 | February | ||
| 6,752 | June | ||
| 6,884 | July | ||
| 6,377 | August | ||
| 6,335 | September | ||
| 6,178 | October | ||
| 2012 | 6,093 | January | |
| 6,429 | February | ||
| 6,556 | June | ||
| 6,231 | July | ||
| 2013 | 6,277 | January | |
| 6,066 | February | ||
| 6,350 | June | ||
| 2020 | 7,408 | April | |
| 6,674 | May | ||
| 6,363 | June | ||
| 6,070 | July | ||
Source: Indiana Business Research Center, using U.S. Bureau of Labor Statistics Local Area Unemployment Statistics (LAUS) data, not seasonally adjusted
Productivity (GDP) and wealth (personal income)
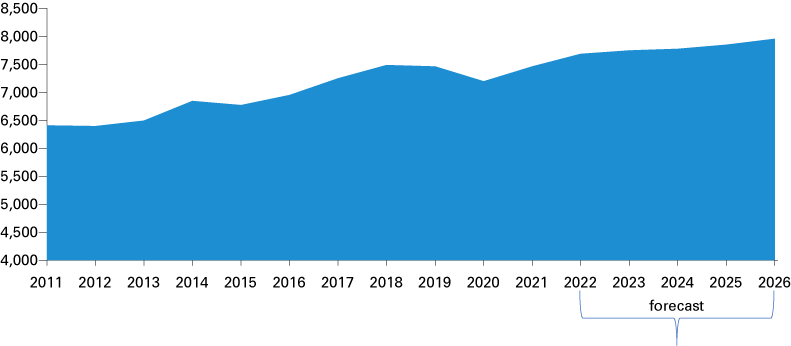
Figure 7: Annual real GDP for Bloomington MSA (in millions of 2017 chained dollars)
Source: Indiana Business Research Center, CEMR forecast models for 2024 Futurecast
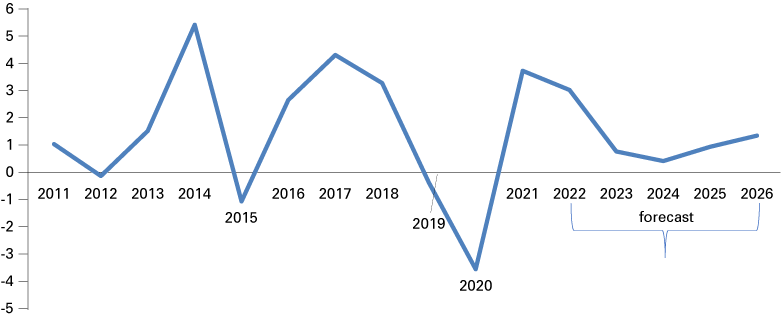
Figure 8: Year-over-year change in Bloomington MSA real GDP (%)
Source: Indiana Business Research Center, CEMR forecast models for 2024 Futurecast
Figure 9: Personal income in the Bloomington MSA (in millions of current dollars)
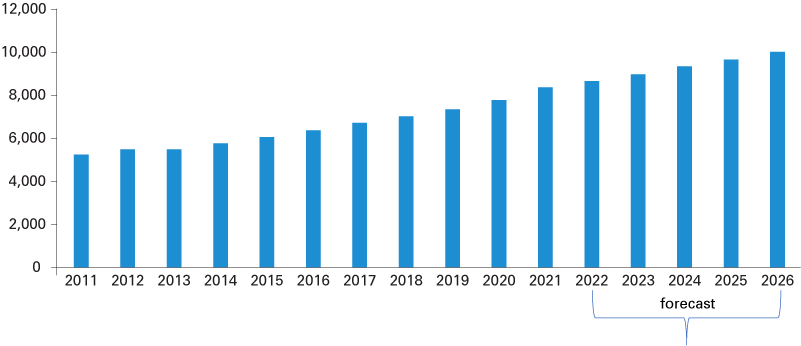
Source: Indiana Business Research Center, CEMR forecast models for 2024 Futurecast
Figure 10: Year-over-year growth rates of personal income in the Bloomington MSA (%)
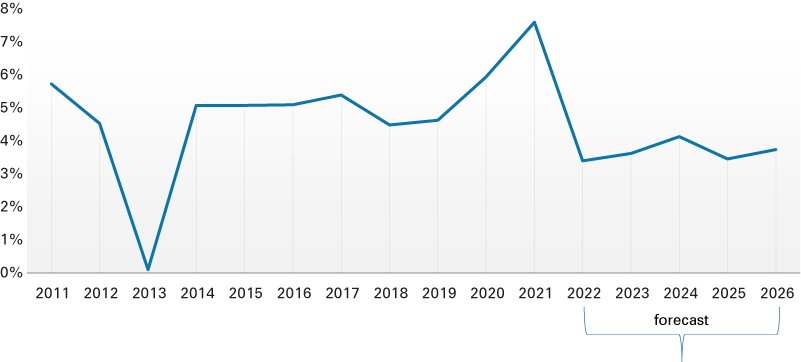
Source: Indiana Business Research Center, CEMR forecast models for 2024 Futurecast
Population growth
Figure 11: Bloomington MSA population (in thousands of persons)
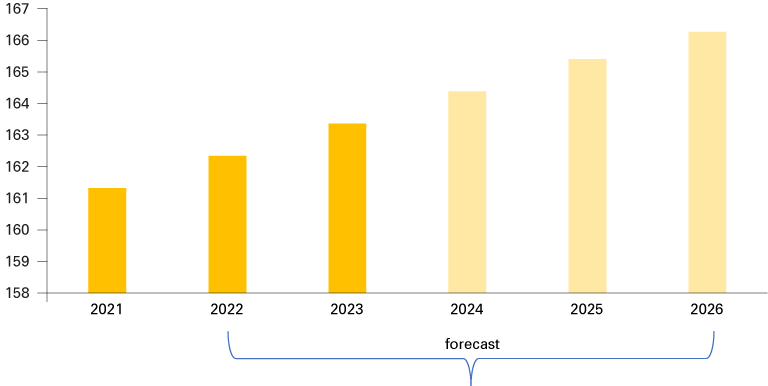
Source: Indiana Business Research Center, CEMR forecast models for 2024 Futurecast
Figure 12: Bloomington MSA year-over-year population growth (%)
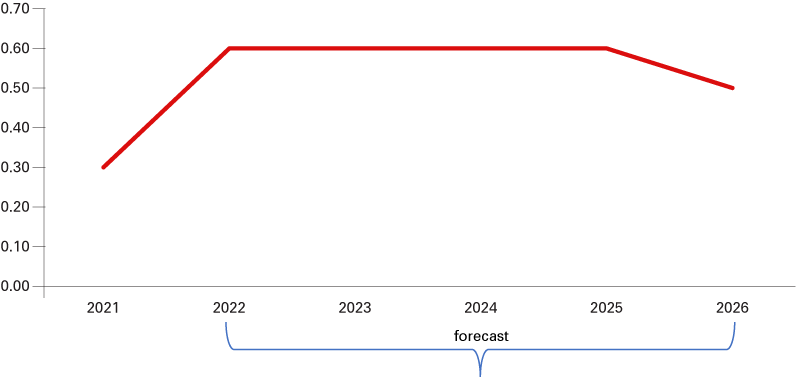
Source: Indiana Business Research Center, CEMR forecast models for 2024 Futurecast
Conclusion
The outlook for the Bloomington metro in 2024 is muted. We don't see drastic swings upward or downward over the next couple of years. But this in itself can serve as a wakeup call. There are constraints to growth in the county, particularly around new housing (unfortunately, we don't forecast housing units). Today's environment calls for the attraction and retention of talent, and a mix of housing types will be a critical factor for those choosing to live in the region.
A welcoming platform for development has been created in the Economic Vitality Project. According to Jennifer Pearl, president of Bloomington's Economic Development Corporation, "The way to grow jobs is to ensure we have sites for employment growth, support our existing employers and promote our community to new employers to locate in Monroe County with sites in areas like the Monroe County Airport, westside employment zones, Trades District and the westside of Ellettsville."
With new investments from the state (READI grants) and the federal government (the CHIPS Program, the Tech Hub Program and infrastructure), along with Indiana University's recently announced nine-figure investments in microelectronics, defense and biosciences, the region has an opportunity to grow its economy in transformational ways.


