
The Indiana housing market: 2024 forecast

Senior Demographer, Indiana Business Research Center, Indiana University Kelley School of Business
Affordability concerns took a toll on Indiana’s market for single-family homes in 2023. Both existing home sales and new construction were down more than 15% year-over-year through the third quarter (see Table 1). Despite this significant drop in demand coupled with rising mortgage rates, house prices continued to climb at a healthy pace due to exceptionally low market inventory. Meanwhile, a strong rate of new household formation—particularly among Indiana’s large millennial generation—meant that Indiana’s apartment construction boom extended well into 2023.
Table 1: Indiana housing market by the numbers
| Indiana | U.S. | |
|---|---|---|
| Existing home sales, September 2023 year-to-date, year-over-year change | -15.5% | -21.1% |
| House price appreciation, 2022 Q2 to 2023 Q2 | 6.1% | 3.0% |
| Single-family building permits (number of units), September 2023 year-to-date, year-over-year change | -15.7% | -13.3% |
| Multi-family building permits (number of units), September 2023 year-to-date, year-over-year change | -2.8% | -17.6% |
| Months supply of inventory, September 2023 | 1.9 | 3.4 |
| Rental vacancy rate, 2023 Q3 | 10.4% | 6.6% |
| Foreclosure rate, 2023 Q3 | 0.6% | 0.5% |
Sources: Indiana Association of Realtors, National Association of Realtors, Federal Housing Finance Agency, U.S. Census Bureau and the Mortgage Bankers Association
Indiana’s growing affordability crisis
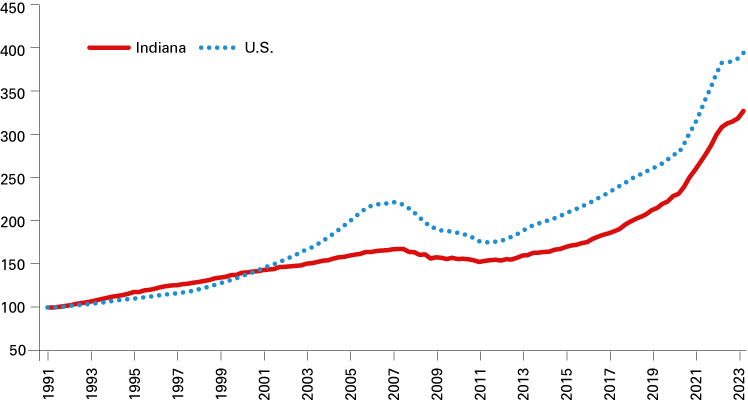
With a 42% increase in home values since the summer of 2020, Indiana has experienced an unprecedented run of house price gains over the last three years (see Figure 1). While the rate of appreciation has cooled somewhat over the past year (the 6.1% annual increase in the second quarter of 2023 was the smallest year-over-year change since mid-2017), the corresponding rise in mortgage rates means the cost of homeownership is increasingly beyond the reach of many prospective buyers.
Figure 1: House Price Index, 1991 Q1 to 2023 Q2
Sources: Federal Housing Finance Agency (seasonally adjusted)
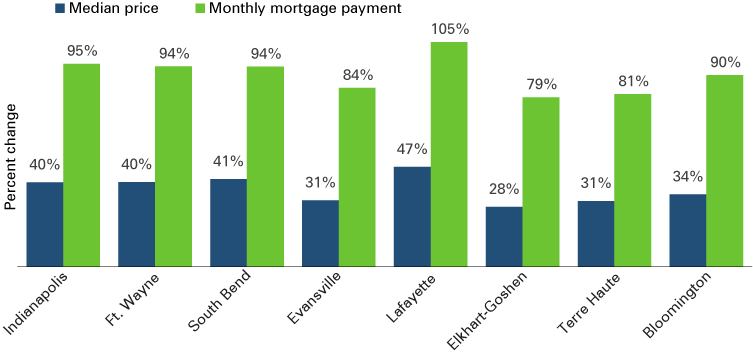
To show the extent to which steep price gains and rising mortgage rates have combined to transform the market over the last three years, Figure 2 presents data from the Federal Reserve Bank of Atlanta that compares changes in both the median sales price and the estimated monthly mortgage payment on the median-priced home between 2020 and 2023.
In the 11-county Indianapolis metro area, for instance, the median sales price in August 2020 was $219,000, and with mortgage rates slightly below 3% at that point, the monthly payment at this price level was an estimated $1,126. By August 2023, the median sales price increased 40% to $305,000, but with mortgage rates now above 7%, the monthly payment on the median-priced home was $2,200—a near doubling of homeowner costs in just three years.
Figure 2: Change in median sales price and monthly mortgage payment on median-priced home, August 2020 to August 2023
Note: This chart is sorted by overall population size.
Source: Federal Reserve Bank of Atlanta, Home Ownership Affordability Monitor
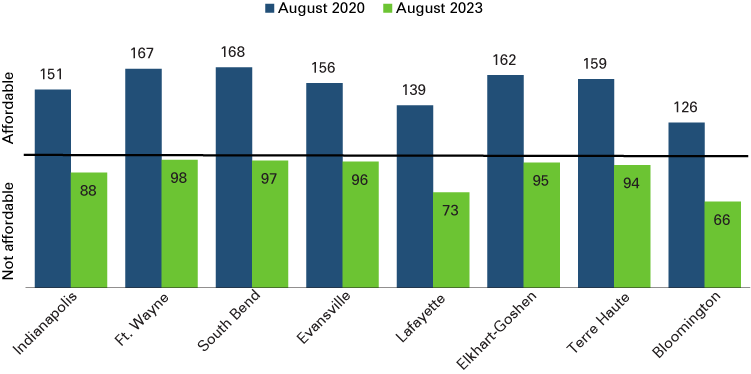
As a result of these rapid increases in cost, the Atlanta Fed’s Home Ownership Affordability Index—where a value below 100 indicates that housing is unaffordable—indicates that median-income households are now unable to afford the median-priced house in each of the state’s large metro areas (see Figure 3).
Figure 3: Home Ownership Affordability Index
Note: This chart is sorted by overall population size.
Source: Federal Reserve Bank of Atlanta, Home Ownership Affordability Monitor
Rental demand on the rise
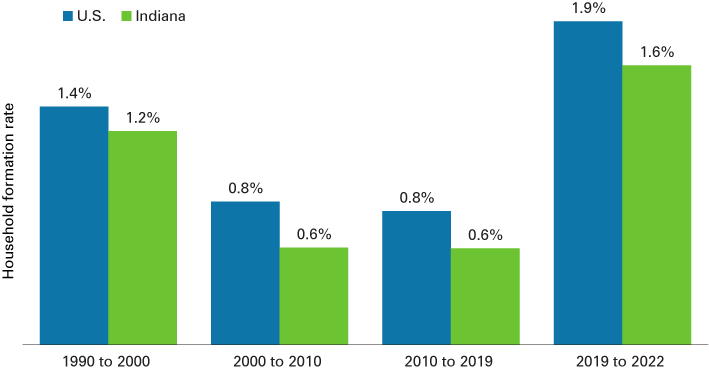
While affordability concerns are stifling the market for single-family homes, the demographic drivers of housing demand are strong. Due largely to the sizeable millennial generation, young adults have flooded Hoosier housing markets in recent years. Between 2019 and 2022, in fact, Indiana saw an increase of more than 93,000 households that are headed by an individual under the age of 45, according to the Census Bureau’s American Community Survey. This influx has spurred the state to its fastest rate of new household formation in decades (see Figure 4).
Figure 4: Average annual household formation rates
Source: U.S. Census Bureau, American Community Survey 1-year estimates
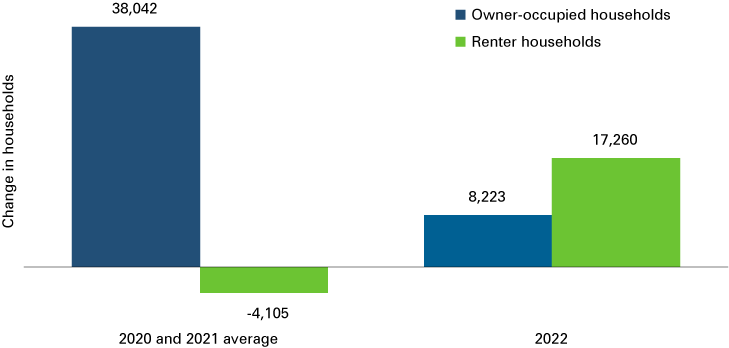
Prior to the sharp rise in mortgage rates, many of these new householders under age 45 became homeowners, while the number of renters in this age group declined (see Figure 5). This led to a significant jump in homeownership rates among Indiana’s young adults after two decades of steep decline in this measure.1 As homeowner costs escalated in 2022, however, new renters in this age group outnumbered new homeowners by more than a two-to-one margin.
Figure 5: Change in number of households by tenure for Indiana population under age 45
Source: U.S. Census Bureau, American Community Survey
Fueled by this increased demand for rental options, Indiana is seeing an unprecedented boom in new apartment construction. In 2022, there were permits issued for nearly 8,800 new units in multi-family developments—a 26% increase over the previous high watermark set in 1998. As Figure 6 shows, the number of new multi-family permits issued through the first three quarters of 2023 is nearly on par with this same period last year. The Indianapolis metro area accounts for 48% of the new units so far in 2023.
Figure 6: New multi-family units authorized by building permits through September year-to-date
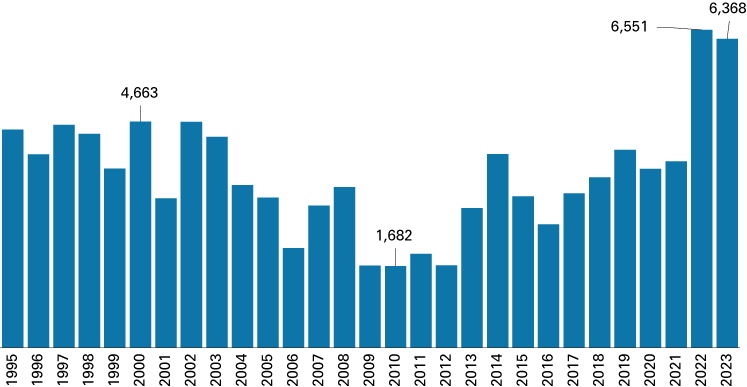
Note: Multi-family refers to structures with five or more units. Data displayed is through September year-to-date.
Source: U.S. Census Bureau
This boost to the supply of rental units has helped slow the rapid rise in rents seen in many Hoosier communities in recent years. In the Indianapolis metro area, for instance, rent increases began to pick up pace in the summer of 2020 and climbed as high as a 12.8% annual change in June 2022. Rent increases have slowed since that point, however, and are now more in line with pre-pandemic rates of growth (see Figure 7). All told, though, most of Indiana’s larger metro areas have seen rents increase by more than 30% between June 2020 and October 2023, according to Zillow Research.
Figure 7: Rent increases, year-over-year change
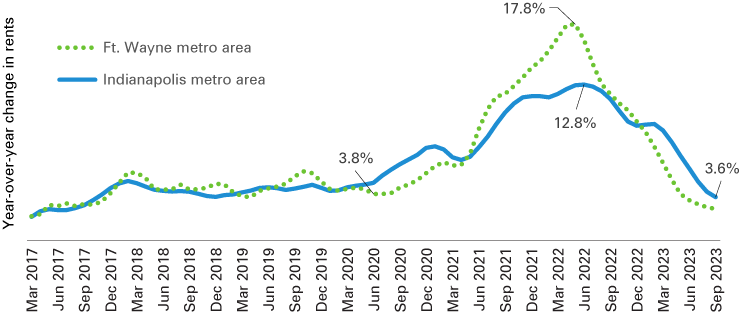
Note: Monthly rent values based on a three-month moving average.
Source: Zillow Research
Housing market outlook
Significant differences in the latest U.S. housing market forecasts by the Mortgage Bankers Association and Fannie Mae point to a murky outlook for 2024 (see Table 2). Fannie Mae analysts are more pessimistic, expecting further declines in new construction and existing home sales, while forecasting mortgage rates to remain near 7%. More upbeat, the MBA predicts a strong rebound in market activity next year along with much lower rates. Both groups expect home values will continue to climb in 2024.
Table 2: National housing market outlook
| Fannie Mae | MBA | Average | |
|---|---|---|---|
| Single-family housing starts, % change in 2024 | -1.7% | 10.6% | 4.5% |
| Existing home sales, % change in 2024 | -0.2% | 5.7% | 2.8% |
| House price appreciation, % change in 2024 | 2.8% | 4.1% | 3.5% |
| 30-year fixed mortgage rate, 2024 average | 6.9% | 6.1% | 6.5% |
Note: Fannie Mae forecast from October 2023; Mortgage Bankers Association forecast from November 2023.
Source: Fannie Mae and Mortgage Bankers Association
Notes
- Matt Kinghorn, “Affordability concerns weigh on Indiana housing market outlook for 2023,” Indiana Business Review, Winter 2022, www.ibrc.indiana.edu/ibr/2022/outlook/housing.html


