
Kokomo forecast 2024

Professor of Business Analytics and Economics
School of Business, Indiana University Kokomo
This article, as part of an annual regional economic analysis series, provides the economic data and forecasts for the Kokomo Metropolitan Statistical Area (MSA). The review also looks at the Indiana University Kokomo service region. This region of north central Indiana includes Carroll, Cass, Clinton, Fulton, Grant, Hamilton, Howard, Madison, Miami, Pulaski, Tippecanoe, Tipton, Wabash and White counties and centers around the city of Kokomo.
The Kokomo regional economy relies on three main components: manufacturing, services and agriculture. More than 70% of employment in this region comes from service-providing industries. However, manufacturing represents a traditional strength of the region and is responsible for almost a quarter of total employment. This is a larger share of the economy compared with both the Indiana and national averages. Agriculture plays an important role outside of the large population centers.
The economic fortune of the region is tied to its strong manufacturing base. While employment and unemployment figures stayed relatively stable between 2022 and 2023, the announcements of two new electric vehicle battery manufacturing facilities by Stellantis and Samsung SDI, as well as additional investments by suppliers in the electric vehicle battery supply chain, are expected to create growth in the region’s employment and GDP in the near future. These investments position the region well for sustained economic growth.
Employment and unemployment
The labor market in the region was tight in 2022 as the economy recovered from the coronavirus pandemic. Unemployment rates, measured as the percentage of the labor force that is unemployed, were close to their historical lows in several of the region’s counties. Throughout 2023, the labor market continued to stabilize and return to normal levels of employment and unemployment. The unemployment rates for most of the region’s counties showed slight increases over the year and stayed in the range between 3% and 4%. The labor force and the numbers of both the employed and unemployed were generally quite steady in 2023.
The region’s economy has a common structure that is reflected in the combined movement of the counties’ unemployment rates, as shown in Figure 1. Howard and Miami counties had the highest unemployment rates in the region, with Howard County, which includes Kokomo, consistently above the regional averages. However, Howard County’s unemployment rate dropped from 7.1% in August 2022 to 5.0% in August 2023, narrowing the gap with the rest of the region. The number of jobs in Howard County remained relatively stable, while the labor force varied from month to month. The county’s economy has a larger share of manufacturing jobs than the rest of the region and the state of Indiana, making it more sensitive to changes in the manufacturing sector.
Figure 1: Regional unemployment rates by county
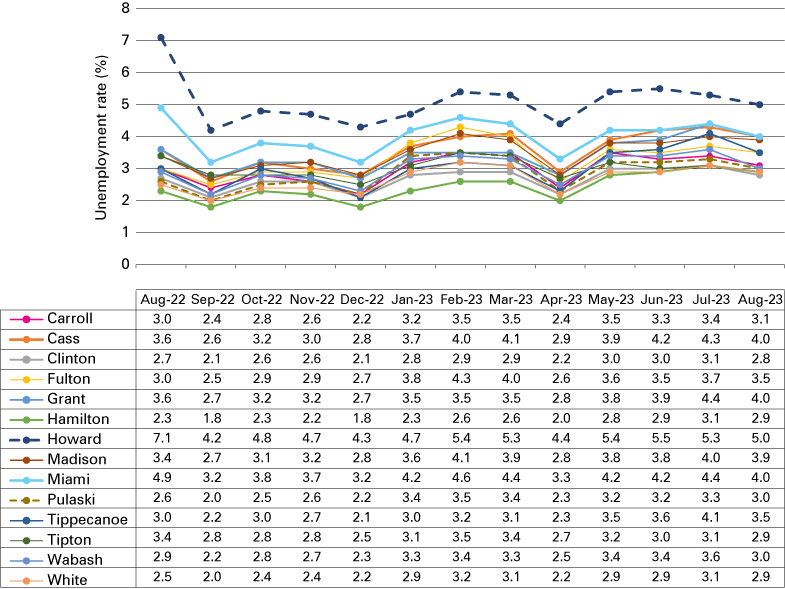
Note: Unemployment rates are not seasonally adjusted. August 2023 data are preliminary.
Source: STATS Indiana, using Local Area Unemployment Statistics (LAUS) from the U.S. Bureau of Labor Statistics
Table 1 shows the structure of employment in the Kokomo MSA encompassing Howard County and the changes in employment between 2022 and 2023. Kokomo’s share of goods-producing jobs is higher than the Indiana and national averages and manufacturing continues to provide close to a quarter of jobs in the Kokomo MSA. Government employment, including public schools and hospitals, is at 13.2% of total employment. Other important sectors include retail trade with 12.1% of employment, as well as leisure and hospitality with 12.4%. The overall number of jobs increased by 2.5% over the year, with the largest increases coming in other services (+10.0%), government (+4.3%) and manufacturing (+3.6%). Most industries did not exhibit significant changes in total employment over the year.
Table 1: Employment in Kokomo MSA by industry, 2022-2023
| Industry | % of total 2023 employment | Employment, August 2023 (thousands) | Employment, August 2022 (thousands) | % change, 2022-2023 |
|---|---|---|---|---|
| Total nonfarm | 100.0% | 36.4 | 35.5 | 2.5% |
| Goods producing | 27.2% | 9.9 | 9.6 | 3.1% |
| Service-providing | 72.8% | 26.5 | 25.9 | 2.3% |
| Natural resources and construction | 3.6% | 1.3 | 1.3 | 0.0% |
| Manufacturing | 23.6% | 8.6 | 8.3 | 3.6% |
| Wholesale trade | 2.2% | 0.8 | 0.9 | -11.1% |
| Retail trade | 12.1% | 4.4 | 4.5 | -2.2% |
| Transportation, warehousing and utilities | 2.2% | 0.8 | 0.9 | -11.1% |
| Information | 0.5% | 0.2 | 0.2 | 0.0% |
| Financial activities | 3.6% | 1.3 | 1.3 | 0.0% |
| Leisure and hospitality | 12.4% | 4.5 | 4.5 | 0.0% |
| Other services | 6.0% | 2.2 | 2.0 | 10.0% |
| Government (includes schools & hospitals) | 13.2% | 4.8 | 4.6 | 4.3% |
Note: Employment numbers are not seasonally adjusted. August 2023 data are preliminary.
Source: STATS Indiana, using Current Employment Statistics (CES) from the U.S. Bureau of Labor Statistics
While the employment numbers in the region stayed stable, there was growth in wages and personal income. Table 2 presents a summary of the average wage data for the Kokomo MSA. Average weekly wages in most industries increased between 2022 and 2023. The largest wage increases occurred in wholesale trade (+18.9%), administrative and support services (+17.2%) and manufacturing (+15.9%). Only two industries saw modest declines in average wages: finance and insurance (-4.5%) and utilities (-2.4%).
Table 2: Average wages in Kokomo MSA by industry, 2022-2023
| Industry | Employment, Q1 2023 |
Avg. weekly wage, Q1 2023 | Avg. weekly wage, Q1 2022 | % change, 2022-23 |
|---|---|---|---|---|
| Total | 34,399 | $1,277 | $1,162 | 9.9% |
| Agriculture and forestry | 90 | $1,021 | $903 | 13.1% |
| Utilities | 130 | $2,190 | $2,243 | -2.4% |
| Construction | 1,180 | $1,091 | $983 | 11.0% |
| Manufacturing | 8,906 | $2,605 | $2,247 | 15.9% |
| Wholesale trade | 788 | $1,608 | $1,352 | 18.9% |
| Retail trade | 4,418 | $630 | $588 | 7.1% |
| Transportation and warehousing | 972 | $1,029 | $895 | 15.0% |
| Information | 299 | $939 | $857 | 9.6% |
| Finance and insurance | 836 | $1,486 | $1,556 | -4.5% |
| Real estate and leasing | 315 | $805 | $730 | 10.3% |
| Professional and technical services | 793 | $893 | $828 | 7.9% |
| Admin. and support services | 967 | $714 | $609 | 17.2% |
| Educational services | 2,798 | $840 | $737 | 14.0% |
| Health care and social services | 5,284 | $981 | $964 | 1.8% |
| Arts, entertainment and recreation | 111 | $416 | $385 | 8.1% |
| Accommodation and food services | 4,039 | $353 | $319 | 10.7% |
| Other services | 1,203 | $526 | $502 | 4.8% |
| Public administration | 1,231 | $924 | $871 | 6.1% |
Source: STATS Indiana, using Quarterly Census of Employment and Wages (QCEW) data from the U.S. Bureau of Labor Statistics
The housing market in the Kokomo MSA also showed steady growth. According to the September 2023 report from Zillow.com, the average home price in Howard County reached $161,836, up 3.8% over the past year. The average home value increased by 50.7% over the past five years.
Economic forecast
The past two years have seen major new announcements that change the face of manufacturing in the Kokomo region. In May 2022, Stellantis and Samsung SDI, as part of the StarPlus Energy joint venture, announced that Kokomo was selected for a new electric vehicle battery manufacturing facility. Stellantis was formed by a merger of Fiat Chrysler with France-based automaker Peugeot. This first battery “gigafactory,” with an investment of $2.5 billion, is scheduled to start production in 2025. Its planned annual production capacity is 33 gigawatt hours (GWh). This factory is expected to create 1,400 new jobs in Kokomo and the surrounding areas.
Just 17 months after the original announcement, Stellantis and Samsung SDI added a second battery manufacturing facility in Kokomo. The second StarPlus Energy plant is expected to begin production in early 2027 and it doubles the venture’s production capacity. For this facility, the joint venture will invest another $3.2 billion, bringing the total investment for both facilities to more than $6.3 billion. The two factories will create 2,800 new jobs, which is close to 8% of the entire Kokomo MSA employment number. The new facilities will supply battery modules for a range of vehicles produced at Stellantis’ North American assembly plants.
The investment by the StarPlus Energy joint venture is supported by significant incentive packages from the city of Kokomo and the Indiana Economic Development Corporation. Some of the tax breaks and investment funds will go to the companies and some will pay for the project’s infrastructure. Some of the incentives are performance-based, so the companies will only receive the incentives once Indiana residents are trained and hired for the new jobs.
The major new investment by Stellantis, as well as the re-tooling of existing facilities, is expected to provide a positive impact on the region’s employment and wages in 2024 and beyond. The Kokomo MSA was behind the state’s other metropolitan areas in employment growth between 2022 and 2023. However, this trend is expected to reverse between 2024 and 2025. Projections made by the Indiana University Center for Econometric Model Research (CEMR) demonstrate that Kokomo is expected to shift to significant growth in total employment in the next two years (see Figure 2). Kokomo is distinct from the surrounding MSAs and Indiana overall, as the other areas in the state expect slower growth and mostly increases in the unemployment rate (see Figure 3).
Figure 2: Average annual employment growth rate data and forecast in selected Indiana MSAs, 2022-2025
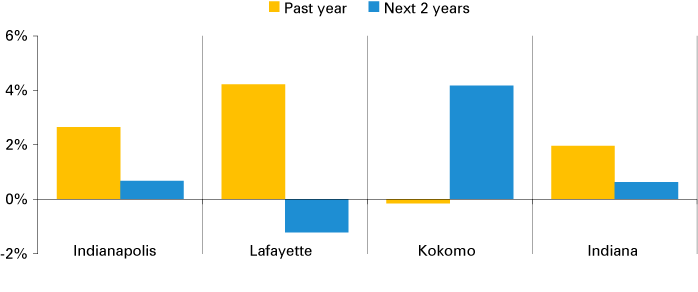
Note: The past year refers to the average annual growth rate from 2022 Q1 to 2023 Q1. The next 2 years refers to the average annual growth rate from 2023 Q1 to 2025 Q1.
Source: Indiana University Center for Econometric Model Research
CEMR forecasts use econometric tools to estimate the employment growth rates and unemployment rates for the state of Indiana. The forecasts are based on trends in labor market data compiled by the U.S. Bureau of Labor Statistics. Current employment and unemployment data show the Kokomo MSA behind the rest of the state. The economic situation in Kokomo is forecasted to improve in 2024 and 2025. As the other Indiana MSAs see slowing employment growth, the Kokomo MSA is expected to show 4% annual growth in employment over the next two years (see Figure 2). The unemployment rate in the Kokomo MSA is expected to decline to around 4% in 2024 and 2025. As the unemployment rates in other areas of the state come closer to long-term average levels, Kokomo is also expected to be closer to the state’s average (see Figure 3).
Figure 3: Unemployment rate data and forecast in selected Indiana MSAs, 2022-2025
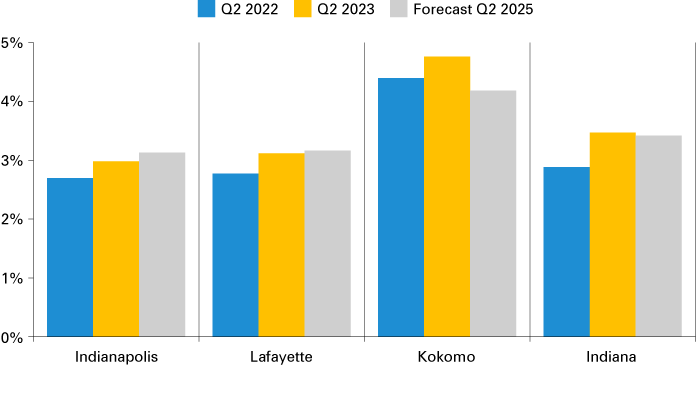
Source: Indiana University Center for Econometric Model Research
Economic and political factors at the national and state level will continue to affect the local economy. Inflation in the U.S. remains stubbornly high and recent increases in interest rates by the Federal Reserve continue to affect the cost of capital for businesses. The demographic situation in the Kokomo region is another area of concern, as there is little to no growth in the population and labor force. In this economic environment, long-term business investment, such as the Stellantis EV battery plants, is especially important. It helps create the basis for sustained economic growth in the Kokomo region.
References
- “Indiana MSA forecast,” Indiana University Center for Econometric Model Research, October 2023, available at: https://ibrc.kelley.iu.edu/analysis/cemr/
- Juranovich, T. “Stellantis, Samsung SDI to build 2nd EV battery plant in Kokomo,” Kokomo Tribune, Oct. 11, 2023.
- Juranovich, T. “City offers tax abatements to 2nd EV battery plant,” Kokomo Tribune, Oct. 17, 2023.
- “Labor force estimates and unemployment rates,” STATS Indiana, www.stats.indiana.edu/topic/laus.asp
- “Stellantis, Samsung SDI announce Kokomo, Indiana as site for second U.S. StarPlus Energy gigafactory,” Stellantis, Oct. 11, 2023, https://www.stellantis.com/en/news/press-releases/2023/october/stellantis-samsung-sdi-announce-kokomo-indiana-as-site-for-second-us-starplus-energy-gigafactory
- “Howard County Home Values,” Zillow, https://www.zillow.com/home-values/1100/howard-county-in/
