Richmond forecast 2020

Director of the Business and Economic Research Center and Associate Professor of Finance, Indiana University East
Total personal income and per capita personal income (PCPI) in Wayne County increased by a larger percentage in 2017 (the most current data available) than in 2016. In contrast, the broader Richmond region1 had smaller growth in 2017. Wayne County’s PCPI did stay a little bit above the regional average but was lagging behind Franklin County and Rush County in the region. On the other hand, most of the other more recent indicators illustrate that economic activity in the region did not improve much in 2019. Both the labor force and unemployment rate of Wayne County and the region were about the same over the two years. Wayne County and the region also had about the same employment in the aggregate private sector, with only a very small increase in the weekly wage. The Wayne County housing market demonstrated some degree of conservatism. No substantial change had been observed in the IU East Regional Business Confidence Index with regard to the original five counties2 in the region (excluding Franklin County and Rush County).
Income
Both Wayne County and the region continued to follow an upward trend in total personal income in 2017 (see Figure 1). This illustrates a persistent improvement in the economic activity and living standard in both the county and the region. Wayne County’s total personal income was $2,639,983,000 in 2017, up 3.1 percent from 2016 (ranking 26th in the state).
Figure 1: Region and Wayne County’s total personal income
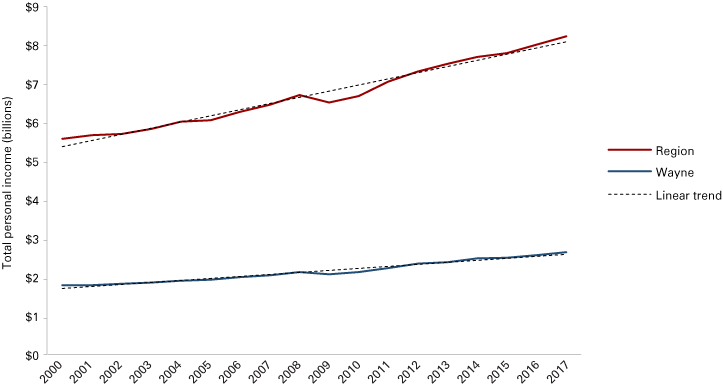
Note: Wayne County had approximately 32.1 percent of the region's income and 31.6 percent of its population based on the 2017 data.
Source: U.S. Bureau of Economic Analysis (BEA) Regional Fact Sheets
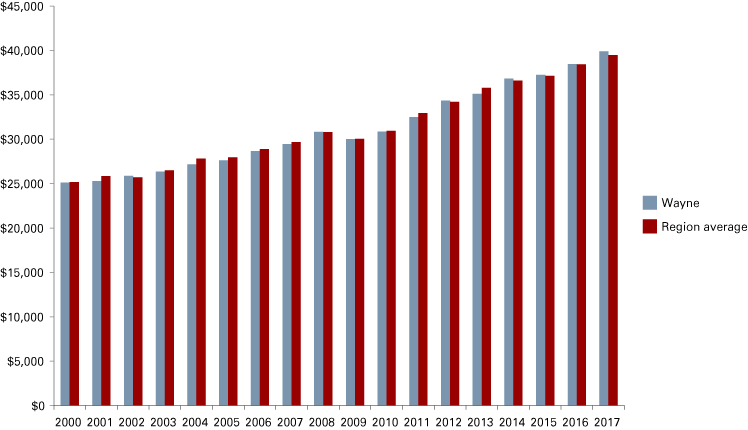
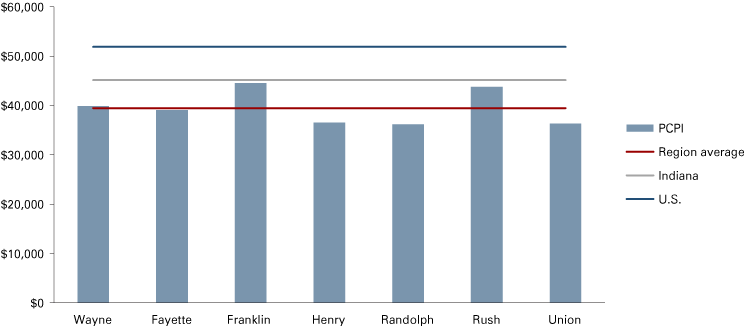
Wayne County had a PCPI of $39,888 in 2017. This was 88 percent of the state average of $45,150. Although Wayne County’s PCPI was slightly above the regional average of $39,462 (see Figure 2), it still lagged behind Franklin County ($44,500) and Rush County ($43,763) in the region.
Figure 2: Region and Wayne County’s per capita personal income
Source: U.S. Bureau of Economic Analysis (BEA) Regional Fact Sheets
Within the state, Franklin County and Rush County enjoyed rankings of 18th and 21st, respectively, while Wayne county was ranked 48th among Indiana’s 92 counties. In addition, only Franklin County and Rush County were catching up with the state average (see Figure 3). The other counties in the region were falling behind significantly—by over 10 percent.
Figure 3: County-level per capita personal income, 2017
Source: U.S. Bureau of Economic Analysis (BEA) Regional Fact Sheets
Labor market
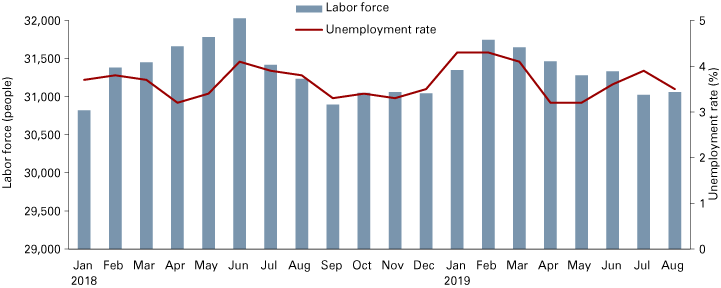
Wayne County’s labor force was made up of 31,061 people in August 2019, representing 31.4 percent of the region’s total labor force of 98,935 people (see Figure 4 and Figure 5). The county’s labor force averaged 31,363 people for the first eight months of 2019, almost the same size (-0.4 percent from 31,472 people) as the same period in 2018.
Figure 4: Wayne County’s labor force and unemployment rate
Note: Data are not seasonally adjusted.
Source: Local Area Unemployment Statistics (LAUS) from the U.S. Bureau of Labor Statistics
Wayne County’s unemployment rate was around 3.7 percent over the summer (June through August 2019), down by 27 basis points from that of the same period of last year, whereas the region’s unemployment rate average was 10 basis points lower than that of Wayne County in both years (see Figure 4 and Figure 5).
Figure 5: Region’s labor force and unemployment rate
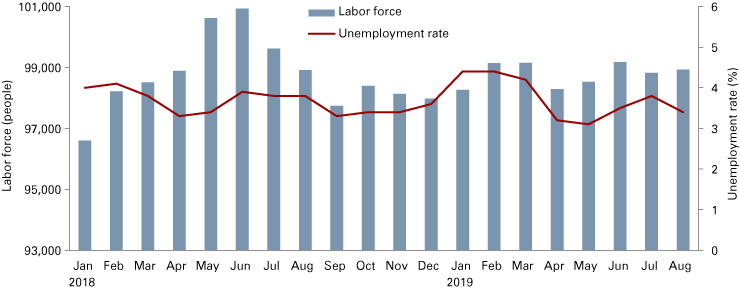
Note: Data are not seasonally adjusted.
Source: Local Area Unemployment Statistics (LAUS) from the U.S. Bureau of Labor Statistics
Although still above the state monthly average (3.5 percent), Wayne County (3.8 percent) succeeded to maintain its average monthly unemployment rate the same as the regional monthly average and below the national monthly average in the first eight months of 2019 (see Figure 6).
Figure 6: Unemployment rate comparison, January 2010 to August 2019
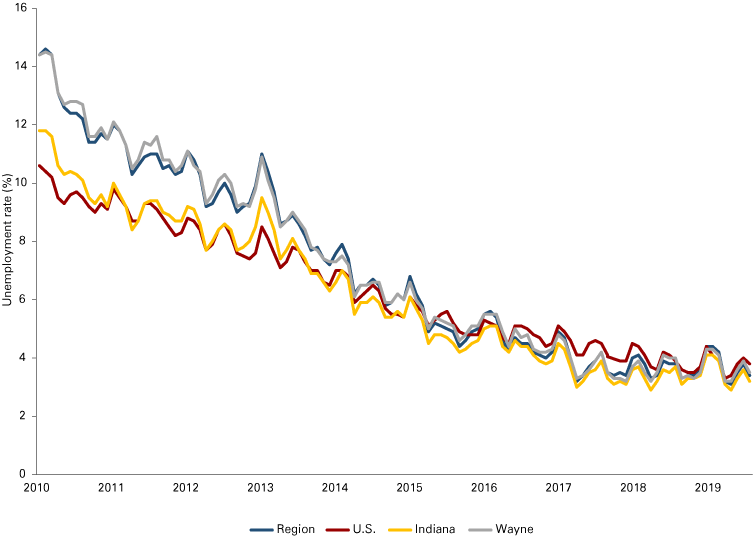
Note: Data are not seasonally adjusted.
Source: Local Area Unemployment Statistics (LAUS) from the U.S. Bureau of Labor Statistics
Jobs and wages
Wayne County’s private sector maintained about the same number of jobs (-7) in the first quarter of 2019, whereas its public sector suffered a loss of 42 jobs, as compared with the first quarter of the previous year (see Table 1). On the other hand, the region gained 61 jobs in the private sector and lost 54 jobs in the public sector. While the retail trade (-134 jobs), administrative, support and waste management (-134 jobs), and the wholesale trade (-95 jobs) sectors in Wayne County took the hardest hits, the health care and social services sector continued to experience non-trivial expansion (+243 jobs). The other sectors that had double-digit job growth included manufacturing (+47 jobs), transportation and warehousing (+36 jobs), agriculture, forestry, fishing and hunting (+23 jobs), and accommodation and food services (+21 jobs). Sectors with a double-digit job decline included construction (-15 jobs), wholesale trade (-95 jobs) and educational services (-28 jobs).
Table 1: Employment by industry
| Industry | Wayne County | Region | ||
|---|---|---|---|---|
| 2019 Q1 | One-year change | 2019 Q1 | One-year change | |
| Total all | 30,240 | -51 | 66,768 | 4 |
| Total private | 26,041 | -7 | 54,781 | 61 |
| Manufacturing | 5,916 | 47 | 13,841 | 127 |
| Retail trade | 3,668 | -134 | 8,013 | -28 |
| Transportation and warehousing | 647 | 36 | 1,268(D) | 277(ED) |
| Agriculture, forestry, fishing and hunting | 228 | 23 | 274(D) | 19(ED) |
| Mining | 24 | 3 | 41(D) | 3(ED) |
| Utilities | 59 | 6 | 178(D) | 71(ED) |
| Construction | 778 | -15 | 2,302 | 149 |
| Wholesale trade | 748 | -95 | 1,679(D) | -349(ED) |
| Information | 199 | 0 | 477(D) | 11(ED) |
| Finance and insurance | 910 | 7 | 1,752 | -2(ED) |
| Real estate and rental and leasing | 138 | 1 | 380 | 1(ED) |
| Professional, scientific, technical | 445 | n/a | 1,019(D) | 394(ED) |
| Management of companies and enterprises | 254 | n/a | 306(D) | 251(ED) |
| Administrative, support, waste management and remediation | 1,757 | -134 | 2,535(D) | -164(ED) |
| Educational services | 536 | -28 | 559(D) | -35(ED) |
| Health care and social services | 6,022 | 243 | 7,394(D) | -1,450(ED) |
| Arts, entertainment and recreation | 128 | 9 | 309 | -65 |
| Accommodation and food services | 2,917 | 21 | 5,913 | 59 |
| Other services (except public administration) | 668 | 2 | 1,549(D) | 43(ED) |
| Government | 4,200 | -42 | 11,989 | -54 |
Note: n/a stands for not available due to data unavailability for 2018 Q1. (D) indicates data with one or more counties excluded due to non-disclosure issues and (ED) indicates estimate made based on such data for 2018 Q1 and/or 2019 Q1.
Source: Quarterly Census of Employment and Wayne (QCEW) data from the U.S. Bureau of Labor Statistics, downloaded via Hoosiers by the Numbers
The average weekly wage for all jobs in Wayne County, the region and the state remained about the same (growing by less than 1 percent) in the first quarter of 2019, as compared with the same period in 2018 (see Table 2). In Wayne County, wholesale trade (+7.6 percent) and educational services (+6.4 percent) had the greatest increases in weekly wages. At the same time, the greatest declines in weekly wage appeared to be found in the mining industry (-15.7 percent), followed by construction (-11.9 percent), utilitites (-9.8 percent), information (-8.1 percent), and arts, entertainment and recreation (-5.5 percent).
Table 2: Average weekly wages
| Industry | Wayne County | Region | Indiana | |||
|---|---|---|---|---|---|---|
| 2019 Q1 | One-year change | 2019 Q1 | One-year change | 2019 Q1 | One-year change | |
| Total all | $764 | 0.9% | $722 | 0.7% | $963 | 0.9% |
| Total private | $768 | 0.7% | $725 | 0.4% | $972 | 0.9% |
| Manufacturing | $939 | 1.0% | $940 | -0.7% | $1,341 | -0.5% |
| Retail trade | $474 | 0.9% | $470 | -0.4% | $544 | 1.7% |
| Transportation and warehousing | $1,010 | -1.2% | $930(D) | 1.8%(ED) | $887 | 2.2% |
| Agriculture, forestry, fishing and hunting | $696 | 0.3% | $654(D) | 0.3% (ED) | $743 | -0.8% |
| Mining | $635 | -15.7% | $598(D) | -6.4% (ED) | $1,430 | 8.7% |
| Utilities | $3,368 | -9.8% | $2,351(D) | -10.5% (ED) | $2,255 | 4.9% |
| Construction | $745 | -11.9% | $792 | -1.9% | $1,077 | 1.1% |
| Wholesale trade | $1,035 | 7.6% | $898(D) | 6.1% (ED) | $1,398 | 0.4% |
| Information | $693 | -8.1% | $643(D) | -6.4% (ED) | $1,219 | 0.7% |
| Finance and insurance | $1,044 | -3.2% | $1,017 | -2.8% (ED) | $1,639 | -2.3% |
| Real estate and rental and leasing | $613 | -1.6% | $543 | 3.2% (ED) | $939 | -0.3% |
| Professional, scientific, technical | $857 | n/a | $805(D) | 18.4% (ED) | $1,328 | 1.6% |
| Management of companies and enterprises | $1,727 | n/a | $1,609(D) | 12.7% (ED) | $2,539 | 1.7% |
| Administrative, support, waste management and remediation | $533 | 2.1% | $606(D) | 3.6% (ED) | $632 | 2.1% |
| Educational services | $809 | 6.4% | $781(D) | 7.0% (ED) | $741 | 0.7% |
| Health care and social services | $953 | -0.8% | $900(D) | 8.7% (ED) | $932 | 2.9% |
| Arts, entertainment and recreation | $328 | -5.5% | $348 | -7.4% | $718 | 6.1% |
| Accommodation and food services | $286 | 0.0% | $272 | 0.0% | $314 | 1.3% |
| Other services (except public administration) | $497 | 1.6% | $443(D) | -4.9% (ED) | $627 | 0.6% |
| Government | $865 | 2.6% | $809 | 2.8% | $1,069 | 1.1% |
Notes: n/a indicates data unavailability for 2018 Q1. (D) indicates data with one or more counties excluded due to non-disclosure issues, and (ED) indicates estimate made based on such data for 2018 Q1 and/or 2019 Q1.
Source: Quarterly Census of Employment and Wayne (QCEW) data from the U.S. Bureau of Labor Statistics, downloaded via Hoosiers by the Numbers
Housing market
Wayne County issued 13 building permits for new single-family homes over the first nine months in 2019, representing an increase of 30 percent from the same period of 2018 (see Table 3). However, the total proposed cost of $3,313,093 was down by 4.5 percent. This implied that developers/residents in Wayne County were pursuing, on average, lower value homes in 2019, relative to the same period of last year.
Table 3: New single-family building permits in Wayne County
| Building permits issued | Proposed cost | |||||
|---|---|---|---|---|---|---|
| 2017 | 2018 | 2019 | 2017 | 2018 | 2019 | |
| January | 0 | 0 | 0 | $0 | $0 | $0 |
| February | 1 | 0 | 0 | $240,000 | $0 | $0 |
| March | 2 | 1 | 0 | $572,000 | $155,000 | $0 |
| April | 2 | 2 | 3 | $440,000 | $1,360,500 | $780,000 |
| May | 2 | 3 | 2 | $483,000 | $967,000 | $654,000 |
| June | 2 | 0 | 2 | $1,025,000 | $0 | $720,000 |
| July | 0 | 1 | 2 | $0 | $250,000 | $329,093 |
| August | 3 | 2 | 3 | $495,000 | $505,978 | $670,000 |
| September | 1 | 1 | 1 | $195,000 | $230,000 | $160,000 |
| October | 3 | 2 | $1,314,000 | $758,850 | ||
| November | 2 | 3 | $829,000 | $749,000 | ||
| December | 1* | 0 | $110,000 | $0 | ||
| Yearly total | 19 | 15 | $5,703,000 | $4,976,328 | ||
| Yearly change from prior year | n/a | -21.1% | n/a | -12.7% | ||
| January-September total | 13 | 10 | 13 | $3,450,000 | $3,468,478 | $3,313,093 |
| January-September change from prior year |
n/a | -23.1% | 30.0% | n/a | 0.5% | -4.5% |
*This is a modular home.
Source: Wayne County Building Commission, Indiana
In Wayne County, single-family home sales were slightly lower (-1.8 percent) in number. There was a significant increase (+7.3 percent) in the median sales price during the first eight months of 2019, as compared with the same period of last year (see Table 4). 558 single-family homes were sold with $98,200 as the median sales price. This pattern very closely resembled that of the rest of the state. According to Tracie Robinson of Better Homes and Gardens First Realty Group, inventory has been low in the county for quite some time. As a result, more homes sold closer to their list price this year than in 2018. There were also signs that the market had stabilized and homes values went up a tick. Fewer sales of foreclosed properties also prevented the average and median sales prices from being dragged down by lower-priced foreclosed homes. On the other hand, despite the interest rate cuts and given the trivial growth in weekly wages, Wayne County developers/residents seemed to be more conservative in building new homes. Except for Union and Wayne counties, all other counties in the region had more aggregate home sales during 2019 when compared to the same period last year. At the same time, only Fayette County (-2.5 percent) and Rush County (-6.3 percent) had a recorded decline in median home sales price; the other counties experienced rising prices.
Table 4: Year-to-date housing market update
| Closed sales | Median sales price | |||||
|---|---|---|---|---|---|---|
| 2018 | 2019 | 2019 change | 2018 | 2019 | 2019 change | |
| Statewide (excluding Wayne County) | 60,916 | 59,784 | -1.9% | $159,000 | $169,000 | 6.3% |
| Fayette | 89 | 99 | 11.2% | $71,000 | $69,200 | -2.5% |
| Franklin | 119 | 131 | 10.1% | $153,000 | $156,500 | 2.3% |
| Henry | 258 | 287 | 11.2% | $86,575 | $99,900 | 15.4% |
| Randolph | 152 | 160 | 5.3% | $76,750 | $78,000 | 1.6% |
| Rush | 2 | 5 | 150.0% | $79,550 | $74,500 | -6.3% |
| Union | 5 | 3 | -40.0% | $35,000 | $87,000 | 148.6% |
| Wayne* | 568 | 558 | -1.8% | $91,500 | $98,200 | 7.3% |
* Single-family homes only
Note: Year-to-date data (including detached single-family homes, condos and townhomes) reflect January through August data.
Source: Indiana Real Estate Market Report by the Indiana Association of Realtors, except Wayne County's data, which were provided by Better Homes and Gardens First Realty Group
Outlook
The IU East Business and Economic Research Center conducted its fourth East-Central Indiana Business Survey in September-October 2019. The survey collects the opinions of business owners or managers on various aspects of business performance and the projection of the overall business and economic conditions in the region’s seven counties (including Fayette, Franklin, Henry, Randolph, Rush, Union and Wayne). Their responses related to the actual performance for this year (2019) and the expected performance for next year (2020), together with their projection on the overall business and economic condition in the region, were summarized and analyzed to form the conclusion on the business outlook for the region. In addition, these responses were also used to compute the value of the 2019 IU East Regional Business Confidence Index (IUERBCI) to continue gauging the business and economic pulse of the region.
The coverage of the survey had been expanded from five counties (Fayette, Henry, Randolph, Union and Wayne) in the previous years (2016 through 2018) to seven counties (with Franklin and Rush added) for 2019. Thus, 2019 index values were calculated based on the original five counties only relative to the base year of 2016, while seven-county 2019 index scores were calculated to serve as the base values going forward.
The composite IU East Regional Business Confidence Index and its sub-indexes stayed about the same values (+/- less than 1 percent) in 2019 as in the previous year (see Table 5). The composite index 2019 value was calculated as 105.2 points, down by 0.9 percent from the previous year value. While the Present Situation Index remained almost the same in value (-0.19 percent), the other sub-index—the Expectation Index—was up by about half a percent (0.6 percent). This suggests that the businesses in those five counties experienced about the same situation this year as in 2018 and expect about the same in 2020 as this year.
Table 5: IU East Regional Business Confidence Index and its sub-indexes
| 2016 (base year) | 2017 | 2018 | 2019 | 2019 (5 counties) | 2019 (7 counties) | ||
|---|---|---|---|---|---|---|---|
| IU East Regional Business Confidence Index value | 100 | 103.98 | 106.08 | 105.18 | IU East Regional Business Confidence Index score | 2,458 | 2,417 |
| Annual change | - | 4.0% | 2.0% | -0.9% | |||
| Present Situation Index value | 100 | 107.11 | 112.43 | 112.23 | Present Situation Index score | 1,074 | 1,048 |
| Annual change | - | 7.1% | 5.0% | -0.2% | |||
| Expectation Index value | 100 | 101.06 | 99.9 | 100.48 | Expectation Index score | 1,041 | 1,028 |
| Annual change | - | 1.1% | -1.2% | 0.6% |
Note: Index values were calculated on the original five counties only (Fayette, Henry, Randolph, Union and Wayne). The seven-county scores will be used for the calculation of the new base year index values for future years.
Source: The 2019 East-Central Indiana Business Survey, conducted by IU East Business and Economic Research Center, September-October 2019.
Over 85 percent of the surveyed businesses were able to either increase their production/business activity (64.1 percent) or maintain the same level as the previous year (22.1 percent), as shown in Table 6. While more than half (51.1 percent) of surveyed businesses hired the same number of employees, another 41.3 percent did enlarge their employee pools. About half (50.8 percent) of the businesses maintained their capital investment at the same level as the year before, whereas over 40 percent increased either significantly (17.7 percent) or slightly (25.4 percent) their capital investment. Half of the survey participants found that their firm’s cost of doing business had increased slightly by less than 5 percent. Only 13.1 percent of them claimed that their firms had experienced a significant increase in this cost. Close to half (48.5 percent) of the surveyed businesses were able to increase their profits whereas about one-third (32.3 percent) managed to maintain their profit level.
Table 6: Compared to the same period last year, how has each of the following changed for your business/company?
| Answer options | Has increased significantly (>5%) | Has increased slightly (<5%) | Has remained about the same | Has decreased slightly (<5%) | Has decreased significantly (>5%) | Response count |
|---|---|---|---|---|---|---|
| Production/business activity | 37.4% | 26.7% | 22.1% | 9.9% | 3.8% | 131 |
| Number of employees | 15.3% | 26.0% | 51.1% | 6.1% | 1.5% | 131 |
| Capital investment | 17.7% | 25.4% | 50.8% | 4.6% | 1.5% | 130 |
| Cost of doing business | 13.1% | 50.0% | 35.4% | 1.5% | 0.0% | 130 |
| Profitability | 15.4% | 33.1% | 32.3% | 16.2% | 3.1% | 130 |
Source: The 2019 East-Central Indiana Business Survey, conducted by IU East Business and Economic Research Center, September-October 2019
Comparing next year (2020) with this year (2019) on the same aspects, 88.5 percent of survey participants expect their firms to increase or at least maintain the same level of production/business activity next year (see Table 7). While over half (56.9 percent) of the businesses would anticipate hiring the same number of employees, 37.7 percent of them would expect to add more employees in 2020. Only 5.3 percent had plans to cut their employment level for next year. A very similar distribution was anticipated in their capital investment as well. On the other hand, about 60 percent of the survey participants expect to see an increase in their firms’ cost of doing business in 2020, while only 4 percent consider a lower cost of doing business likely for next year. As far as for the profitability of their firms, over 85 percent of the survey participants had hopes of either generating higher profit (51.6 percent) or maintaining the same level (33.6 percent) in 2020.
Table 7: How do you anticipate each of the following will change next year for your business/company as compared with this year?
| Answer options | Will increase significantly (>5%) | Will increase slightly (<5%) | Will remain about the same | Will decrease slightly (<5%) | Will decrease significantly (>5%) | Response count |
|---|---|---|---|---|---|---|
| Production/business activity | 24.4% | 35.1% | 29.0% | 8.4% | 3.1% | 131 |
| Number of employees | 9.2% | 28.5% | 56.9% | 3.8% | 1.5% | 130 |
| Capital investment | 9.3% | 26.4% | 55.8% | 7.0% | 1.6% | 129 |
| Cost of doing business | 7.0% | 53.1% | 35.9% | 2.3% | 1.6% | 128 |
| Profitability | 14.1% | 37.5% | 33.6% | 12.5% | 2.3% | 128 |
Source: The 2019 East-Central Indiana Business Survey, conducted by IU East Business and Economic Research Center, September-October 2019
While more than a quarter (27.6 percent) of the surveyed businesses believed the economic condition in 2020 would remain about the same as in 2019, more than half of them (53.5 percent) were optimistic (either strongly or moderately) and less than one-fifth (18.8 percent) were pessimistic about the condition (see Table 8).
Table 8: How do you project the overall business and economic conditions in 2020 in your area?
| Answer option | Response percent | Response count |
|---|---|---|
| Strongly optimistic | 10.2% | 13 |
| Moderately optimistic | 43.3% | 55 |
| About the same | 27.6% | 35 |
| Moderately pessimistic | 15.7% | 20 |
| Strongly pessimistic | 3.1% | 4 |
| Total | 100.0% | 127 |
Source: The 2019 East-Central Indiana Business Survey, conducted by IU East Business and Economic Research Center, September-October 2019
Taking into consideration the continuously weak pace of global economic activity and uncertainty in future global trading systems given the rising trade and geopolitical tension, the International Monetary Fund (IMF) released a revised downward forecast of the global economic growth to 3 percent3 for 2019, down from the 3.7-percent4 forecast at this time last year. The IMF even considered this newly revised percentage growth as the lowest level since the 2008-09 global financial crisis. At the same time, they projected that the world would likely see 3.4 percent growth in 2020. Although the economic performance was projected to improve in a number of emerging markets, uncertainty about the prospects for several of these countries, together with the projected slowdown in China and the U.S., indicate a dimmer future in the global economy in 2020. In the same release, the IMF had projected that the U.S. economy would grow by 2.1 percent in 2020. Although the recent two-year budget and the Federal Reserve’s interest rate cuts would supplement the weakening effect of the previous tax cuts, uncertainty over global trade policy would hinder economic growth in the United States. In the press release for their September 2019 meeting,5 the Federal Open Market Committee (FOMC) raised their forecast of the U.S. GDP growth to 2.2 percent for 2019 from their forecast of 2.1 percent in June this year. The newly revised forecast was also agreed upon by the Wall Street economists at large.6 The FOMC’s GDP outlook for 2020 remained unchanged at 2 percent7 (just 0.1 percent lower than the forecast made by the IMF).
Summary
Still clouded by a lot of uncertainties in the global trading system and the lack of improved confidence in doing business in the area, Wayne County and the region will likely not see much growth in 2020. While interest rate cuts will help ease the cost of doing business, firms might hold back on their hiring and/or pay raises depending on the industry and their exposure to the global trade tension. The unemployment rate is expected to continue swinging a little around the 4 percent threshold through next year.
In an economy with expected slower growth in the region at this time and the year ahead, enterprises and individuals may want to think more before making significant financial commitments. At the same time, government may want to work on appropriate incentives to stimulate growth.
Acknowledgements
The author deeply appreciates the feedback and support provided by Dr. Litao Zhong, the former Director of the IU East Business and Economic Research Center and Associate Professor of Economics and Finance, as well as Dr. Denise S. Smith, Dean of the School of Business and Economics. Thanks also go to Tracie Robinson, Broker Associate/Sales Manager of Better Homes and Gardens First Realty Group, for the provision of housing data for Wayne County and the region, as well as Debbie Bailey of the Office of Building Commission for the provision of Wayne County building permit data.
Notes
- The Richmond region includes seven east-central Indiana counties: Fayette, Franklin, Henry, Randolph, Rush, Union and Wayne.
- The index began with only five counties in 2016 (the base year); Franklin County and Rush County are newly added components in 2019. The composite index score and the sub-index scores for the seven counties for 2019 will serve as the base for the future values of the index and sub-indexes.
- International Monetary Fund, “World Economic Outlook: October 2019—Global Manufacturing Downturn, Rising Trade Barriers,” October 2019.
- International Monetary Fund, “World Economic Outlook: October 2018—Challenges to Steady Growth,” October 2018.
- Federal Open Market Committee, “Transcript of Chairman Powell’s Press Conference,” September 2019.
- Harriet Torry, “Economists Don’t See Path to 3% Growth in 2019”, Wall Street Journal, September 12, 2019.
- Federal Open Market Committee, “Minutes of the Federal Open Market Committee,” September 17–18, 2019.


