Gary forecast 2020

Director of the Center for Economic Education & Research and Associate Professor of Economics, School of Business and Economics, Indiana University Northwest
In 2019, Northwest Indiana1 grew slower than the state of Indiana and the nation overall, and this will likely be the case again in the coming year. Despite this lack of substantial economic growth, in recent years, Northwest Indiana has shown evidence of a healthier industry mix of employment. This evidence, coupled with positive growth in population for the first time in years, suggests improving economic fundamentals that may support greater economic growth in the coming years. At the same time, economic growth has been held back by the ongoing international trade war as tariffs, which were designed to boost manufacturing and the steel industry, have begun to harm more than help. With stronger fundamentals, the economic growth for Northwest Indiana over the next few years will depend more on national issues, such as the trade war and a threatening recession, than on regional issues. The following sections will outline recent trends in economic growth, employment and population for Northwest Indiana and identify areas of potential economic challenges in the next year.
Northwest Indiana economic growth
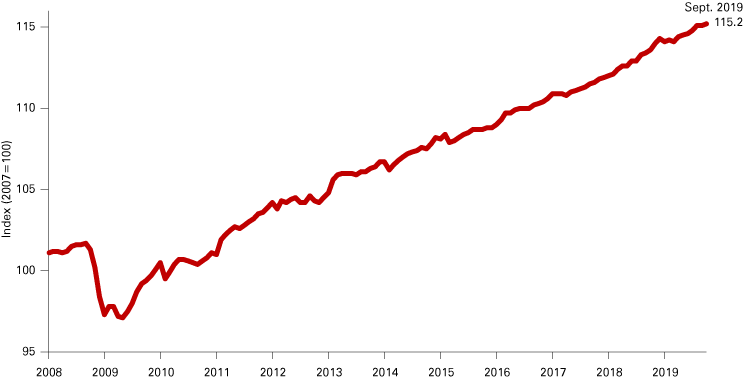
During 2019, the Northwest Indiana Coincident Economic Index,2 which measures the economic health of Northwest Indiana, rose from 114.1 in December 2018 to 115.2 in September 2019, growing at an annualized rate of 1.3 percent. This is substantially slower than the growth of the national economy (+3.0 percent) and the economy of the state of Indiana (+2.1 percent) measured by similar coincident indices during this same period.3 Figure 1 shows the Northwest Indiana Coincident Economic Index from 2008 to 2019.
Figure 1: Northwest Indiana Coincident Economic Index

Source: Northwest Indiana Coincident Economic Index (http://go.iu.edu/nwi)
Growth during 2019 was also slower than the 1.9 percent growth the region experienced in 2018, but slightly above the average annual growth rate of 1.2 percent per year for the previous five years (2012-2017). Inflation in 2019 was also unusually high, with prices rising at an annualized rate of 1.4 percent in Midwest urban areas during the last four quarters (2018 Q3 to 2019 Q3), compared with an inflation rate of 1.9 percent in 2018 and an average annual inflation rate of 0.9 percent between 2015 and 2017.4 While the economic output of Northwest Indiana, measured by gross metropolitan product (GMP),5 rose during the first three quarters of 2019 to $30.9 billion (up $446 million or 1.5 percent from one year before), when adjusting for inflation, the economy of Northwest Indiana grew little. Table 1 shows the growth rate of real GMP/GDP per capita for Northwest Indiana compared with the state and the nation in recent periods.
Table 1: Real GMP/GDP per capita
| Northwest Indiana | Indiana | United States | |
|---|---|---|---|
| 2018 Q2 to 2019 Q2 | $34 (+0.1%) | $353 (+0.7%) | $974 (+1.7%) |
| 2018 | $21 (+0.1%) | $746 (+1.7%) | $1,462 (+2.5%) |
| 2012-2017 (annual average) | -$51 (-0.1%) | $714 (+1.5%) | $935 (+1.7%) |
Source: Northwest Indiana Gross Metropolitan Product (http://go.iu.edu/nwi) for Northwest Indiana GMP, U.S. Bureau of Economic Analysis for state and national GDP, U.S. Census Bureau for population and U.S. Bureau of Labor Statistics for inflation rates
Between the second quarter of 2018 and the second quarter of 2019, real (adjusted for inflation) GMP per capita grew by just $34 per person in Northwest Indiana. This growth was substantially slower than the gain of $353 per person for the state of Indiana and $974 per person nationally over the same period. Despite being small, this period (and 2018 overall) was the first four-quarter period of positive real income growth per person Northwest Indiana has experienced in some time. Between 2012 and 2017, real GMP per capita declined on average by $51 per year. This numerically small—but symbolically important—growth is likely due, at least in part, to a strengthening industry mix in employment.
A strengthening industry mix in employment
Following the official end of the Great Recession in June 2009, much of the United States recovered quickly. Northwest Indiana was no exception. Between 2009 and 2013, economic output in Northwest Indiana6 rose 8.1 percent (2.0 percent per year), while total employment rose 5.4 percent.7 However, following this period of recovery, economic growth slowed substantially. During 2014 and 2015, economic output grew at only 1.1 percent per year.
One of the primary reasons for this slowing growth was structural changes in employment. In 2013, the $4.2 billion BP-Whiting modernization project began to approach completion. At its peak, this private project employed as many as 14,000 union ironworkers, boilermakers and other specialty trade contractors—most of which were high-paying jobs (with average annual pay of $60,775 in 2015). While total employment for the region continued to grow during 2014 and 2015, the increase in number of jobs concealed a change in the nature of these jobs. As high-paying trades jobs related to the modernization project were being eliminated, they were replaced with significantly lower-paying service sector jobs in industries like food service and drinking places (with average annual pay of $13,313 in 2015) and general merchandise stores (with average annual pay of $18,248 in 2015). There were some exceptions, and employment in higher-paying industries like ambulatory health care services (average annual pay of $54,992 in 2015) did rise.
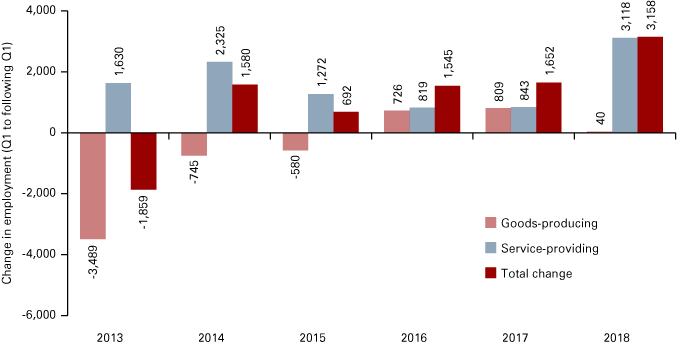
Figure 2 shows the annual change in Northwest Indiana employment, broken down by goods-producing and service-providing sectors. For further discussion of the rise in lower-paying service-sector jobs in Northwest Indiana, see the 2017 Gary forecast.8 This trend of replacing higher-paying goods-producing jobs with lower-paying service sector jobs was concerning and, had it continued, it may have posed a serious threat to the long-term health of the Northwest Indiana economy.
Figure 2: Annual change in Northwest Indiana employment by sector

Source: Quarterly Census of Employment and Wages data from the U.S. Bureau of Labor Statistics
However, there are signs that this trend began to reverse in 2016. As Figure 2 shows, during the last three years jobs in the goods-producing sector have begun to rise. Table 2 shows the 10 fastest-growing private industries by employment between 2015 and 2019. High-paying goods-producing industries that had previously been decreasing in employment, such as specialty trade contractors, machinery manufacturing, and plastics and rubber manufacturing, have all added jobs since 2015. Likewise, higher-paying service-providing industries also grew, such as ambulatory health care services and professional and technical services. While low-paying food service and drinking places continue to be one of the fastest-growing sources of jobs in Northwest Indiana, growth in these other higher-paying industries has contributed to a healthier industry mix of employment.
Table 2: Fastest-growing private industries by employment
| Industry | Employment change, 2015-2019 | 2019 average annual pay |
|---|---|---|
| 1. Ambulatory health care services | +2,091 | $55,889 |
| 2. Food services and drinking places | +2,062 | $15,039 |
| 3. Administrative and support services | +1,388 | $27,240 |
| 4. Specialty trade contractors | +1,304 | $62,929 |
| 5. Nursing and residential care facilities | +636 | $30,894 |
| 6. Machinery manufacturing | +605 | $67,192 |
| 7. Warehousing and storage | +597 | $35,998 |
| 8. Gasoline stations | +487 | $19,559 |
| 9. Professional and technical services | +391 | $52,433 |
| 10. Plastics and rubber manufacturing | +382 | $52,971 |
Source: Quarterly Census of Employment and Wages data from the U.S. Bureau of Labor Statistics
Table 3 shows the 10 fastest-declining private industries by employment between 2015 and 2019. The obvious standout is the primary metal manufacturing industry, a traditionally high-paying industry, which between 2015 and 2019 lost 1,614 jobs (-8.3 percent). Much of this loss occurred in the last quarter of 2018 and the first quarter of 2019 and was related to the challenges facing the steel industry, which are discussed below. Other than primary metal manufacturing, those industries that have experienced the fastest-declining employment have generally been middle-to-lower-paying service-providing industries.
Table 3 : Fastest-declining private industries by employment
| Industry | Employment change, 2015-2019 | 2019 average annual pay |
|---|---|---|
| 1. Primary metal manufacturing | -1,614 | $100,268 |
| 2. Amusements, gambling and recreation | -657 | $32,777 |
| 3. Educational services | -608 | $27,577 |
| 4. Food and beverage stores | -483 | $21,727 |
| 5. General merchandise stores | -369 | $21,551 |
| 6. Truck transportation | -356 | $55,057 |
| 7. Merchant wholesalers (nondurables) | -259 | $64,367 |
| 8. Electronics and appliance stores | -170 | $32,706 |
| 9. Publishing industries, except internet | -155 | $59,068 |
| 10. Miscellaneous manufacturing | -146 | $39,316 |
Source: Quarterly Census of Employment and Wages data from the U.S. Bureau of Labor Statistics
Positive population growth and net domestic migration
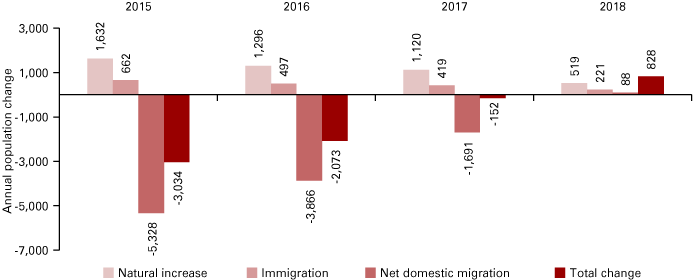
Since the last decennial census, Northwest Indiana has faced a problem of declining population. Between 2010 and 2017, the population in Northwest Indiana declined by 1.1 percent (or -0.2 percent per year on average).9 During the same period, Indiana’s population rose 2.6 percent (+0.4 percent per year on average) while the U.S. population rose 5.3 percent (+0.8 percent per year on average). The largest driver of this population decline has been negative net domestic migration—i.e., the region experienced more people moving away (often to major metropolitan areas like Chicago, Bloomington or West Lafayette) than moving into the region. However, in 2018, for the first time in years, Northwest Indiana saw a small rise in population with the addition of about 1,050 people, or a 0.1 percent increase. While this increase was small, it was driven by a promising trend in net domestic migration that has been occurring over the last few years. Figure 3 shows the components of population change for Northwest Indiana since 2015.
Figure 3: Components of Northwest Indiana population change

Source: U.S. Census Bureau
While net domestic migration was negative for 2015-2017, it has grown gradually less negative and became positive in 2018, with more people moving into Northwest Indiana than out of the region. This is likely due, at least in part, to the ongoing and combined efforts of local and state economic development agencies and organizations, such as the Indiana Regional Development Authority (RDA), Northwestern Indiana Regional Planning Commission (NIRPC), the Northwest Indiana Forum and others, to improve local amenities and quality of place. Some significant projects include the “Ignite the Region” initiative,10 the expansion and modernization of the South Shore Line and improved greenspace, bicycle and walking trails. While one year of positive population growth, even coupled with the trend of increasing net domestic migration, is not conclusive evidence of a real reversal, it is an early and important sign of Northwest Indiana becoming a more desirable place to live.
Steel tariffs and manufacturing
In March 2018, at the beginning of the current “trade war” between the United States and China, the United States imposed a 25 percent tariff on imported steel on the grounds of national security, under Section 232 of the Trade Expansion Act of 1962. During the months leading up to this announcement, and those immediately after, the domestic steel industry began to boom. Between the second quarters of 2017 and 2018, steel futures rose 60 percent (from $575/short-ton to $920/short-ton)11 and the share price of U.S. Steel (X) and ArcelorMittal (MT) rose 85.1 percent and 51.2 percent, respectively.12 Shipments and new orders for U.S. iron and steel mills grew 16.6 percent and 19.6 percent, respectively.13 During this time, both U.S. Steel and ArcelorMittal ratified union contracts that provided substantial raises for workers and announced major investment projects to mills in Northwest Indiana.
Unfortunately, these gains were short-lived. As the trade war dragged on and it became clear that steel tariffs were not being used as a short-term negotiation tool but rather were becoming a long-term fixture, these gains were reversed. Overcapacity and decreased demand for American-made steel became significant obstacles. Between the second quarters of 2018 and 2019, steel futures fell 43.2 percent (from $920/short-ton to $523/short-ton) and the share price of U.S. Steel (X) and ArcelorMittal (MT) fell 71.4 percent and 55.4 percent, respectively. Meanwhile, shipments and new orders for U.S. iron and steel mills fell 5.1 percent and 4.6 percent, respectively. Some of the planned investment projects in the mills were canceled or put on hold. This decline has not only been limited to the steel industry but broader manufacturing as well. The Manufacturing Purchasing Managers Index, which is published by the Institute for Supply Management (ISM) and is an important gauge of manufacturing health, has fallen by 12.2 points (-20 percent) in the last year, and September marked its lowest level since June 2009. While steel and steel-related industries are some of the most significant single industries in Northwest Indiana, the health of these industries is closely linked to other manufacturing industries in the area and nationwide.
Northwest Indiana economic outlook and forecast for 2020
While the economic fundamentals of Northwest Indiana have strengthened significantly in the last few years with an improving industry mix and increasing population, national economic issues have been—and will continue to be—the more significant force at play in the region for the coming years. Without a clear and quick resolution, the ongoing trade war is likely to continue to depress the steel and manufacturing industries. While there have been some recent movements to reduce tariffs, even if such agreements can be reached, they would likely, at best, return the steel industry to the status quo of 2018 and not resolve any of the long-term issues the industry faces.
Escalating inflation and the probability of a coming recession are also concerns. As mentioned above, prices have risen at almost twice the usual rate so far in 2019. Accelerating inflation will add additional stress to the U.S. economy and reduce real economic growth in Northwest Indiana. In addition, the U.S. interest rate spread, the difference between long-term and short-term interest rates, has been negative since June 2019. This interest rate spread is a traditional indicator of a coming recession and has not been negative since 2008, prior to the Great Recession. Finally, should a recession occur within the next year, the Federal Reserve may be in a poor position to respond. A common tool for stimulating the economy during a recession is to lower interest rates. However, interest rates are already at historic lows, with the Federal Reserve recently lowering the targeted range for the federal funds rate to between 1.5 percent and 1.75 percent. This means that the Federal Reserve may have little room to lower interest rates further, a traditional method of combating a recession. Finally, as 2020 will be an election year, there will likely be additional economic uncertainty for political reasons.
The forecast for Northwest Indiana in 2020 is similar in many ways to that from 2019. It includes a high degree of uncertainty due to national issues. Table 4 shows the previously forecasted and actual growth for Northwest Indiana for 2019, as well as the forecast for 2020. In the coming year, economic growth, as measured by the Coincident Index and GMP, is likely to be less than in 2019. Employment is likely to grow at a modest rate, with greater employment in higher-paying service-providing industries. However, there is a high degree of uncertainty behind these forecasts, which will depend heavily on how national economic issues resolve.
Table 4: Northwest Indiana regional forecasts (Q3 to Q3)
| 2019 forecast | 2019 actual | 2020 forecast | |
|---|---|---|---|
| Northwest Indiana Coincident Index |
+1.8% to +2.0% | +1.5% | +0.8% to +1.2% |
| Employment | +0.9% (+2,500 jobs) |
+0.7% (+1,900 jobs) |
+0.7% (+2,000 jobs) |
| Unemployment rate | 4.0% | 3.9% | 4.0% |
| Gross metropolitan product (GMP) | +$550 million to +$610 million | +$446 million | +$300 million to +$340 million |
Source: Author’s calculations
Notes
- Unless otherwise indicated, the term “Northwest Indiana” refers to the tri-county region of Lake, Porter and LaPorte. The economic trends discussed here are not substantially different whether “Northwest Indiana” is defined as the tri-county region, the four-county region (Gary Metropolitan Division) or the seven-county region (Indiana Economic Growth Region 1).
- The Northwest Indiana Coincident Economic Index is published monthly by the Center for Economic Education & Research at Indiana University Northwest at http://go.iu.edu/nwi and reflects the four counties of Lake, Newton, Jasper and Porter.
- State and national coincident indices are published by the Federal Reserve Bank of Philadelphia.
- Based on the Consumer Price Index (CPI) for all items for urban consumers in the Midwest area, published by the U.S. Bureau of Labor Statistics.
- The Northwest Indiana Gross Metropolitan Product (GMP) is published quarterly by the Center for Economic Education & Research at Indiana University Northwest at http://go.iu.edu/nwi and reflects the four counties of Lake, Newton, Jasper and Porter.
- As measured by the Northwest Indiana Gross Metropolitan Product (GMP).
- Based on Quarterly Census of Employment and Wages data from the U.S. Bureau of Labor Statistics.
- Micah R. Pollak, “Gary Forecast 2017,” Indiana Business Review, Winter 2016, www.ibrc.indiana.edu/ibr/2016/outlook/gary.html.
- U.S. Census Bureau, Annual Community Survey (ACS).
- For more information on the “Ignite the Region” initiative, please see www.nwiforum.org/economic-initiative.
- FactSet Fundamentals, U.S. Midwest Domestic Hot-Rolled Coil Steel Near-Term Futures.
- FactSet Fundamentals.
- U.S. Census Bureau, Manufacturers’ Shipments, Inventories & Orders, Iron and Steel Mills.


