Columbus forecast 2020

Visiting Associate Professor of Management, Indiana University Division of Business, Indiana University–Purdue University Columbus
The Columbus metropolitan statistical area (MSA) has long supported a strong manufacturing-based economy linked to the transportation industry and light vehicle manufacturing. While structural changes have occurred over the years, dependence on these two industries continues as more than 50 percent of the Columbus MSA gross domestic product (GDP) has stemmed from durable goods manufacturing since 2012.1 Columbus has experienced seven years of solid economic growth starting in 2010, excluding the minor 0.1 percent decline in GDP in 2016, which reflected a 3.5 percent decline in durable goods manufacturing and a 24.2 percent decline in real estate (which were partially offset by increases in natural resources and trade).2 With strong business investment plans, a flat year for Cummins, solid consumer confidence, and stable light vehicle sales in North America, Columbus should conclude 2019 on a positive note as we approach 2020. In light of mixed economic indicators, current projections are for the local economy to grow during 2020 at a pace between 0 percent and 1 percent.
Key measures
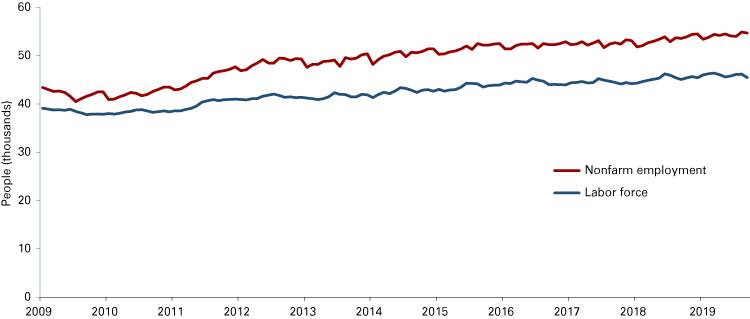
Employment and labor force: From 2011 to 2018, the Columbus MSA nonfarm job growth ranged between 400 and 4,200 annually, resulting in a total increase of 11,200 jobs (see Figure 1). In the first nine months of 2019, job growth of approximately 200 positions reflects an increase in nonfarm positions of less than 1 percent.
Figure 1: Labor force and nonfarm jobs, January 2009 to September 2019
Note: Data are not seasonally adjusted.
Source: U.S. Bureau of Labor Statistics
In 2017 (the latest commuting data available), Columbus attracted approximately 13,100 workers or 20 percent of the workforce from outside the county (including Johnson, Jackson, Jennings, Brown and Marion counties).3 Based on the same 2017 data, approximately 5,100 Bartholomew county residents commute to Jackson, Marion, Johnson and Decatur for their jobs. Between 12,000 and 13,500 workers from outside Columbus will continue to be required for staffing local firms and, therefore, commuting patterns should remain relatively stable. However, labor supply pressures are expected to increase as new employers, such as Amazon, enter markets in surrounding counties.
Labor force participation: Labor force participation rates for the U.S. and Indiana have remained relatively stable between 63 percent and 65 percent since 2014.4 The Columbus labor participation rate increased from 2014 to 2018 to a reading of 72 percent. This high labor force participation rate reflects the growing tension between job need and talent availability in the area, placing pressure on firms seeking to expand or replace retiring employees. Additionally, weekly earnings pricing pressures can be seen in the data, as the high labor force participation rate coupled with the low unemployment rate results in competition for the limited labor resource pool.
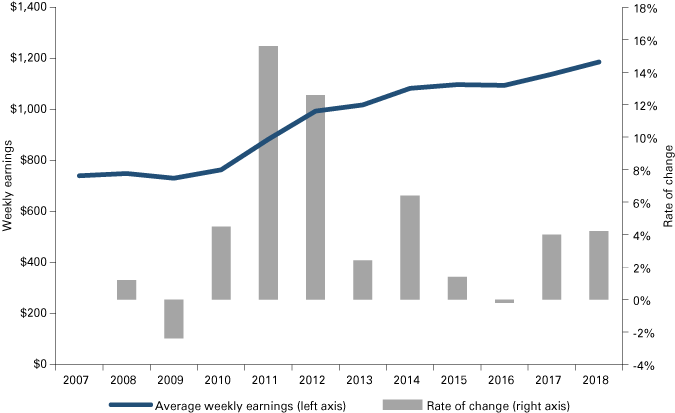
Weekly earnings: Weekly earnings for the Columbus MSA have experienced an impressive 62 percent growth from a low of $730 in 2009 to $1,186 in 2018. As the labor market has tightened between 2014 and 2018, weekly earnings have increased 10 percent, while inflation (measured by national CPI-U) impacted consumer spending power by 5.8 percent during the same period.5 However, the first nine months of 2019 reflect a decline in weekly earnings from 2018. September 2019 weekly earnings are 0.5 percent lower than September 2018, with each month in 2019, except June, reflecting lower weekly earnings than the prior year. This same trend is reflected in average weekly hours.
Average weekly hours have climbed from 37.4 per week in 2016 to the highest level in over 10 years of 40.2 per week in 2018—reflecting a growth of more than 7 percent in this two-year interval (see Figure 2). This growth trend was not reflected in 2019, as average weekly hours for each of the first nine months of 2019 are below the 2018 levels. The rate of growth for average hourly earnings has declined from about 6 percent in 2014 to around -1 percent in 2018.6 However, average hourly earnings have increased in 2019, with September 2019 reflecting a 6 percent increase from September 2018.
Figure 2: Average weekly earnings in the Columbus MSA
Source: U.S. Bureau of Labor Statistics and Indiana Department of Workforce Development
Unemployment: The continuing economic strength in the U.S., Indiana and Columbus pushed unemployment rates lower in September. The unemployment rate for the U.S. was 3.3 percent in September, while Indiana’s unemployment rate (not seasonally adjusted) was 2.8 percent—the lowest September rate since 2000.7 Columbus’ September unemployment rate of 2.0 percent (not seasonally adjusted) is also the lowest September unemployment rate since 2000. The Columbus MSA unemployment rate is slightly lower than in the counties contiguous to Bartholomew, reflecting the solid employment base in this county. Table 1, which shows selected Indiana metros and micros, highlights that unemployment rates are lower than the national average across the state. This table also demonstrates the greater volatility of Indiana’s unemployment rate with changes in national economic trends.
Table 1: September unemployment rate comparison for selected Indiana metros and micros
| 2009 | 2010 | 2011 | 2012 | 2013 | 2014 | 2015 | 2016 | 2017 | 2018 | 2019 | |
|---|---|---|---|---|---|---|---|---|---|---|---|
| U.S. | 9.5% | 9.2% | 8.8% | 7.6% | 7.0% | 5.7% | 4.9% | 4.8% | 4.1% | 3.6% | 3.3% |
| Indiana | 10.0% | 9.5% | 9.0% | 7.7% | 6.9% | 5.4% | 4.2% | 4.1% | 3.3% | 3.1% | 2.8% |
| Bloomington | 6.1% | 7.7% | 8.2% | 7.1% | 6.3% | 5.3% | 4.2% | 4.2% | 3.3% | 3.1% | 2.7% |
| Columbus | 10.1% | 8.5% | 7.3% | 5.7% | 5.2% | 3.9% | 3.1% | 3.1% | 2.5% | 2.2% | 2.0% |
| Evansville | 7.9% | 8.0% | 7.6% | 6.9% | 6.3% | 4.8% | 3.7% | 3.9% | 2.9% | 2.9% | 2.6% |
| Greensburg | 9.7% | 10.0% | 9.3% | 8.2% | 7.6% | 5.8% | 4.5% | 4.3% | 3.7% | 3.3% | 3.0% |
| Indianapolis-Carmel-Anderson | 8.7% | 8.9% | 8.7% | 7.5% | 6.6% | 5.2% | 3.9% | 3.8% | 3.2% | 3.0% | 2.6% |
| Kokomo | 13.0% | 11.1% | 10.1% | 8.5% | 7.2% | 5.6% | 4.3% | 4.0% | 3.4% | 3.3% | 3.2% |
| North Vernon | 13.3% | 11.4% | 11.2% | 9.3% | 7.9% | 5.7% | 4.1% | 4.2% | 3.3% | 3.1% | 2.5% |
| Seymour | 11.5% | 9.7% | 8.7% | 6.9% | 5.8% | 4.5% | 3.5% | 3.4% | 2.8% | 2.6% | 2.3% |
Note: Data are not seasonally adjusted.
Source: U.S. Bureau of Labor Statistics
Planned business investment: Columbus firms continue with business investment planning, although the level is down from the recent peak of $153.2 million in 2015. Eight projects in 2018 totaling $135.4 million were followed by six planned projects in 2019 for $60.4 million. Since 2011, an estimated $810 million of planned investment in the Columbus MSA was projected to create an estimated 2,900 jobs (see Table 2). With the planned investments announced in 2019, this business investment trend continues to reflect confidence by local businesses.
Table 2: Columbus MSA planned business investment announcements
| Year | Number of expansions | Planned investment ($ millions) | Number of employees |
|---|---|---|---|
| 2008 | 3 | 16.05 | 511 |
| 2009 | 0 | 0 | 0 |
| 2010 | 11 | 23.68 | 515 |
| 2011 | 9 | 35.52 | 945 |
| 2012 | 15 | 52.41 | 199 |
| 2013 | 18 | 135.98 | 884 |
| 2014 | 11 | 52.64 | 130 |
| 2015 | 9 | 153.15 | 171 |
| 2016 | 7 | 103.76 | 79 |
| 2017 | 6 | 80.73 | 91 |
| 2018 | 8 | 135.38 | 189 |
| 2019* | 6 | 60.40 | 257 |
* Announced
Source: Greater Columbus Economic Development Board
Economic indicators
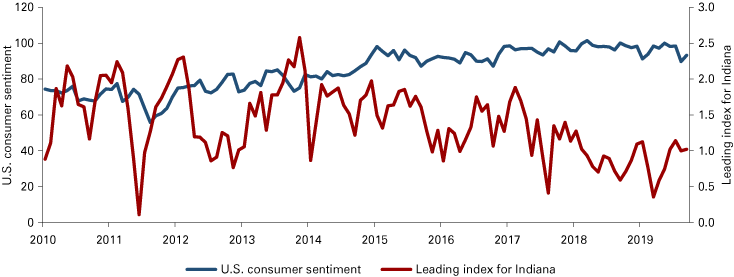
Leading index for Indiana: The leading index for Indiana (LII) developed by the Philadelphia Federal Reserve Bank reflects a six-month forecast that considers nonfarm payroll, average hours worked, the unemployment rate, wage and salary disbursements, housing permits, initial unemployment claims, delivery times, and interest rate spreads.8 The LII has been trending down since reaching a peak of 2.5 in November 2013, reflecting Indiana’s cyclical economy—which is even more pronounced in Columbus, where automotive supply and diesel engine components manufacturing are the main drivers of GDP. The LII has been above 1 since June 2019, reaching a high of 1.14 in July. This may indicate moderate strengthening of the outlook for Indiana and the Columbus area.
Consumer sentiment: Consumer sentiment is a leading indicator developed by researchers at the University of Michigan (see Figure 3). This indicator continues at a high level, moving over 100 in October 2017, March 2018, September 2018 and again in May 2019—levels that have not been observed since January 2004.9 The October 2019 index of consumer sentiment of 95.5 reflects continued strength in consumer perceptions of the economy. Consumers’ expectations of economic growth result from improving personal finances buttressed by rising weekly wages and expectations of controlled inflation.
Figure 3: Leading index for Indiana and consumer sentiment for the U.S.
Source: Philadelphia Federal Reserve Bank and the University of Michigan
One cloud on the horizon for consumers that could adversely affect wages going forward is the largely unknown impact of changes to foreign trade relations and tariffs. Approximately one-third of the survey participants voiced trade-related concerns.10 Current impeachment proceedings are also viewed as a distraction at the federal government level, diverting attention from economic and trade policies. Changes to tariffs causing blockages in international business transactions, particularly as it relates to North American borders, would disproportionately affect the state of Indiana on the whole—and Columbus, specifically, as a production area heavily concentrated in automotive supply—since parts are known to cross international borders several times en route to becoming part of a light vehicle.11
Purchasing Manager’s Index (PMI): The PMI has declined to below 50 with a reading of 48.3 in October, up 0.5 from September and down 10.5 from November 2018. A reading below 50 indicates the manufacturing economy is contracting. The September reading reflects decreasing confidence in manufacturing from contracting new orders, new export orders, backlog orders and consumption. Based on the national supply executive’s index, the overall economy has grown for 126 consecutive months, and manufacturing has begun to decline.12
Interest rates and the yield curve: The U.S. Treasuries yield curve, reflected in Figure 4, inverted in May 2019 as the spread between two-year notes and 10-year notes declined to zero. Based on recent actions and statements by the U.S. Federal Reserve, short-term rates are expected to decrease into 2020 as a mechanism to offset the impact of trade uncertainty and declining economies in other parts of the world. After increasing rates four times in 2018, the Federal Reserve has reduced short-term rates three-quarters of a percentage point in 2019. An additional quarter to half percentage point decrease in short-term rates is anticipated for 2020.13
Yield curve inversion, where two-year rates are equal to or higher than 10-year rates, has been associated with a recession in the near future.14 Campbell Harvey, using the spread between three-month and 10-year Treasuries indicated inversion occurred in March of this year and again in May.15 Professor Harvey’s research indicates economic downturns occur six to 18 months following inversion.
Figure 4: Treasury rates and the yield curve
Of particular interest to the Columbus area, interest rates influence the demand for durable goods. Automobile and transportation-related purchases decline as interest rates rise due to higher ownership costs and a lower number of consumers qualifying for purchase. However, interest rates appear to have peaked in November 2018 and have declined in 2019, possibly providing support for consumer spending in 2020.
Vehicle and light truck sales worldwide are expected to decline by approximately 2 percent from 2018 to 2019.16 Similarly, light vehicle sales throughout North America are expected to enter the final stages of the automotive business cycle. This trend can be seen in Figure 5.
Figure 5: U.S. monthly vehicle sales with annual trend line
Favorable for the U.S. vehicle and light truck industry, inventories appear to be under control with an inventory-to-sales ratio below 2.5 (see Figure 6). Also positive for car and light truck sales, the aging of the U.S. fleet has returned to a traditional rate of 4 percent.17 While the average age is at a high of 11.8 years, the slowing of aging reflects reasonable purchase rates by consumers. Additionally, as cars and light trucks age, replacement will be necessary.
Figure 6: U.S. monthly vehicle inventory/sales ratio
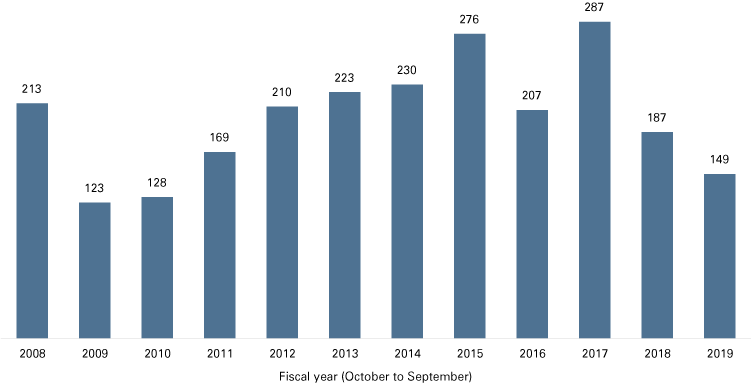
Local building permits: After a strong fiscal year 2017 for building permits in Columbus (287 permits), residential building permits declined by 35 percent in fiscal year 2018 to 187. This was followed by an additional decline of 20 percent in fiscal year 2019 (149), as reflected in Figure 7. The fiscal year 2019 data reflect a decline in building permits (28) in the October through December time frame from an average performance in the same period in fiscal year 2018 (45). The number of building permits in the January to September period of fiscal year 2019 of 121 is the lowest level since 2011 (132). Because the rate of building permits growth is a leading indicator of economic activity, the continuing decline does not constitute a good omen for the Columbus MSA going forward.
Figure 7: Local fiscal year building permit trends for the Columbus MSA
Source: U.S Census Bureau
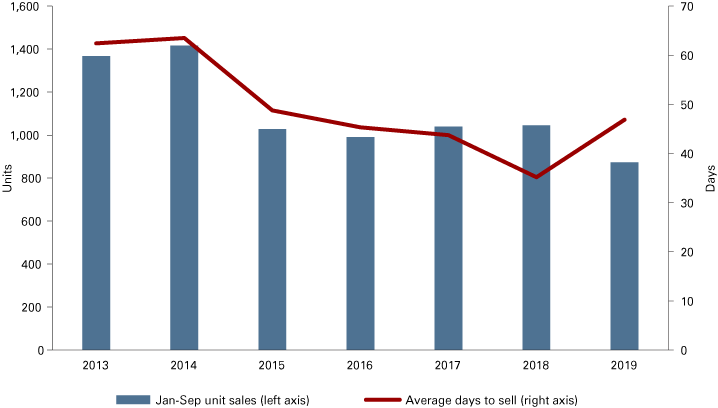
Residential housing sales: Residential housing sales in Columbus have continued below the peak experienced in the 2013-2014 period when inventories remained high from the recession. Between 2015 and 2018, residential sales have remained steady at approximately 1,000 units during the first nine months of the year. Year-to-date sales have declined to approximately 900 in 2019 (see Figure 8). The average days on the market declined from about 62 days in 2013 and 2014 to 35 days in 2018 and have rebounded to 47 in 2019. The reduction in days reflects a tightening of inventory alongside less new construction available for sale. Also noteworthy, the average median price has increased from $134,000 in 2013 to $187,000 in 2019.
Figure 8: Columbus MSA real estate sales and average days on the market
Source: Metropolitan Indianapolis Board of Realtors, National Association of Realtors and Indiana Association of Realtors
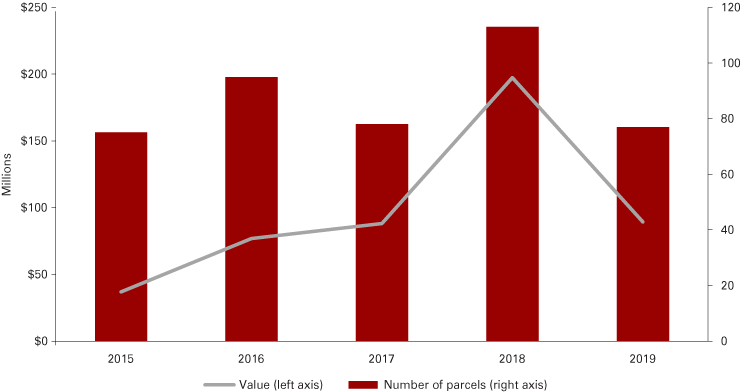
Commercial real estate sales: Commercial real estate sales in Columbus have continued relatively strong since 2016. Commercial real estate sales doubled from 2015 to 2016 and have since remained in a range slightly below $100 million, adjusting 2018 for a large transaction in May 2018 (see Figure 9). This is also reflected in a relatively flat number of parcels trading hands. While inventories of existing structures remain tight, parcels of land available for construction have increased slightly—providing opportunity for growth or new investment.
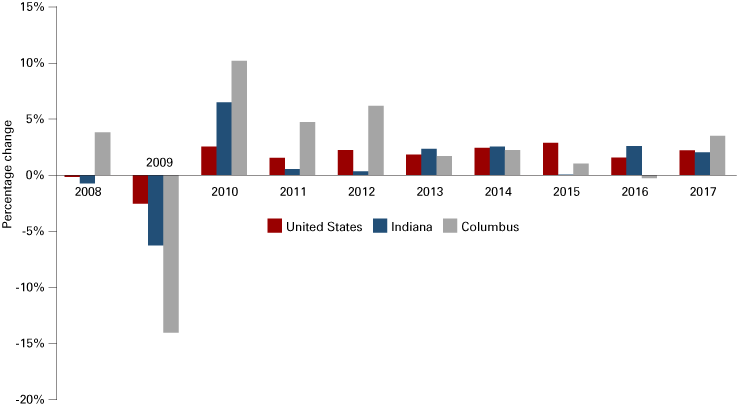
Local real GDP growth: Chained GDP for Columbus increased by 3.9 percent in 2017 after falling slightly in 2016 (see Figure 10). Over the last 10 years, Columbus chained GDP has increased an average of approximately 2 percent per year. This period includes the Great Recession and the strong growth period for Columbus of 2010, 2011 and 2012, where the local economy rebounded in cyclical fashion typical of heavily manufacturing-based economies.
Figure 10: Year-over-year chained GDP growth
Source: U.S. Bureau of Economic Analysis (chained GDP)
However, even with the increase in 2017, the average rate of GDP growth in Columbus has slowed the past three years, falling below the average GDP growth rates for the nation, state, Bloomington and Indianapolis-Carmel-Anderson (see Table 3). This slowing may reflect weakness in demand for the recession-vulnerable products produced in the Columbus area.
Table 3: Annual GDP growth rate comparison for selected Indiana metros and micros
| 2014 | 2015 | 2016 | 2017 | 10-year average | 3-year average | |
|---|---|---|---|---|---|---|
| United States | 2.5% | 2.9% | 1.6% | 2.2% | 1.5% | 2.2% |
| Indiana | 2.6% | 0.1% | 1.7% | 1.6% | 1.0% | 1.7% |
| Bloomington | 1.0% | 1.1% | 3.1% | 4.7% | 0.8% | 3.0% |
| Columbus | 2.3% | 1.0% | -0.3% | 3.5% | 1.9% | 1.4% |
| Evansville | -2.4% | -0.9% | 1.6% | 1.0% | -0.2% | 0.5% |
| Indianapolis-Carmel-Anderson | 1.0% | -0.2% | 3.7% | 2.5% | 1.2% | 2.0% |
| Kokomo | 1.8% | 1.8% | 0.1% | -2.1% | 0.7% | -0.1% |
Source: U.S. Bureau of Economic Analysis (chained GDP)
Columbus Area Stock Index (CASI): The composition of the Columbus economy may be reflected by an index of publicly traded securities relevant to the community. CASI was developed as a tool to keep abreast of the returns performance of securities affecting the local community and as a tool useful for forecasting local economic conditions.
CASI is an economy-size-weighted index, which weights each component by the number of total jobs estimated to be produced and available in the Columbus MSA. Therefore, securities were selected using area employment as a basis for inclusion in the index. Not all sectors in the local economy were considered. Where the economic condition of a sector was estimated to change relative to some other independent sector, then the dependent sector was excluded.
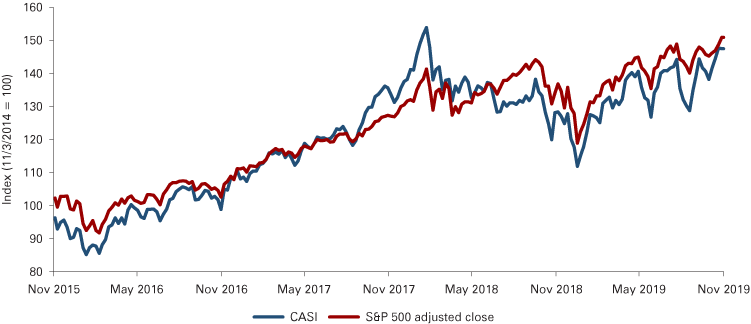
Over the past five years, CASI and the S&P 500 have performed virtually identically, with the S&P outperforming CASI slightly, with an annual return of 8.6 percent, while the CASI returned annual gains of 8.1 percent. Yet, CASI—in usual fashion—also came with additional volatility. The S&P 500 produced a standard deviation of 13.0 percent, while CASI produced a standard deviation of 16.1 percent (see Figure 11).18
Figure 11: CASI and S&P 500 performance comparison
Source: Dr. Ryan Brewer and Yahoo Finance
National and global considerations
National and global issues are intricately coupled as many changes in one nation influence the economies of other nations. Oil prices, interest rates and manufacturing in different parts of the world influence and are influenced by actions within the United States.
National issues: Following the 2018 elections, the executive and legislative branches of government developed an adversarial relationship. This change to a more adversarial relationship appears to have hindered major activities, such as budgets, tariffs and national health care policies, at the federal level. Less progress at the federal government level coupled with higher prices due to the tariffs and trade wars could dampen economic activity in the latter half of 2019 and 2020.
Global issues: Global real GDP growth of approximately 2.6 percent is not unreasonable for 2019, although escalating trade tensions and rising debt provide downside risks.19 Global real GDP growth for 2020 is forecast to increase to 2.7 percent—with advanced economies slowing from 1.7 percent in 2019 to 1.5 percent in 2020. China’s GDP growth rate continues to decline, remaining below 7.0 percent since 2015. This continuing decline coupled with trade disputes reduce the prospects for export-driven businesses, including Cummins. Because Cummins relies upon China for growth prospects outside its North American trucking business (long and mid-range hauls), this poses a threat to the Columbus economy in 2020.
Outlook
Strong employment and declining interest rates should continue to support consumer spending. However, rumors and rhetoric about tariffs and trade wars, threats of inverted yield curves and the potential for increasing inflation due to wage pressures could soften the Columbus economy.
Upside potential
Leading general indicators
- North American light vehicle sales remain relatively stable around 17.7 million vehicles for the fifth consecutive year.
- Consumer sentiment remains favorable but showing signs of erosion due to economic uncertainty.20
- Columbus MSA GDP for 2017 increased at its fastest rate since 2012.
- The Columbus Area Stock Index (CASI) has increased this year, following the S&P 500 increase.
- Cummins stock (CMI) has improved in 2019 from a low of $136 at the beginning of January to $174 on November 1. This improvement occurred in contrast to the third-quarter revenues and earnings reports. The improvement in stock price may reflect investor support of company efforts toward innovation and consistency.
Additional planned investments: The Columbus Economic Development Board announced in 2019 that six businesses in Columbus plan to spend more than $60 million for expansion, potentially creating more than 257 new jobs.
Cummins: Cummins celebrated its 100th year since its founding in 1919. Cummins continues to be the leading manufacturer of commercial diesel engines in North America, with approximately a 40 percent market share—more than double the nearest competitor.21 Importantly, the U.S. and Canada account for approximately 60 percent of the company’s sales. Cummins revenues for 2019 are expected to be down 2 percent from the prior year, with profitability also following this trend.22 Lower North American truck production and lower demand for off-highway construction equipment are driving the lower revenue forecasts.
In the third quarter of 2019, Cummins posted sales of $5.8 billion (down 3 percent from the third quarter of 2018), with North American markets flat and international business decreasing 8 percent. Net income in the third quarter of 2019 was $622 million, down 10 percent from the third quarter of 2018. While the distribution and power system segments increased in revenue for the quarter, the engine and components segments’ sales both declined.
The 2020 outlook for Cummins should be flat to slightly lower than this year, with growth in North American markets offset by declines in the China and India markets.
Downside potential
Leading general indicators
- The PMI fell below 50 in August this year and dropped to 47.8 in September, the lowest level since June 2009. Levels below 50 indicate the manufacturing economy is generally contracting.
- Residential housing sales and building permits continue to exhibit weakness for a fourth year.
Automobile industry: North American light vehicle sales have been relatively flat since reaching a seasonally adjusted peak of 17.8 million during the third quarter of 2015. Current projections reflect flat sales for the remainder of 2019 and through 2020.23
Employment base: Continuing the sentiment from the 2019 forecast, Columbus continues to have a high rate of labor force participation, low unemployment and rising wages. With the introduction of additional competitors for employees, such as Amazon in Greenwood, GDP growth may be hindered by the lack of population growth and the number of unfilled jobs.
Forecast
For a second year, Columbus is expected to experience flat to slightly positive real GDP growth for 2020 of 0 percent to 1 percent, with performance strongest in the first half of the year. Risks exist that might lead to weaker results. Continued uncertainty in the nation’s capital, trade uncertainty, fewer building permits on file, tightening of business investment and a further tightening of the labor market will challenge GDP growth. Yet, wage growth should support the consumer segment of GDP. Unemployment is expected to increase slightly to 2.5-3.0 percent in 2020, with new participants entering into a market with essentially no job growth. Additionally, flat North American light vehicle sales may influence production in the second half of 2020. These negative pressures will be countervailed somewhat by the area’s high average weekly wages, which may spur retail sales and keep durable goods sales levels from falling harder than we would like.
The current economic expansion is the longest in U.S. history. Economic expansions do not die of old age; however, several factors stated above could create the tipping point for this expansion to slow significantly.
Notes
- U. S. Bureau of Economic Analysis data retrieved October 07, 2019, from https://apps.bea.gov/iTable/iTable.cfm?isuri=1&reqid=70&step=1#isuri=1&reqid=70&step=1
- See note 1.
- Annual commuting trends profile. (2019, March 28). STATS Indiana. Retrieved from www.stats.indiana.edu/dms4/commuting.asp
- Indiana Department of Workforce Development. Indiana labor force participation rate. Hoosiers by the Numbers. Retrieved October 24, 2019, from www.hoosierdata.in.gov/indicator/ind.aspx?indicator_id=10&indicator_geo=18000&indicator_style=full&indicator_mode=html
- U.S. Bureau of Labor Statistics. Chained CPI for all urban consumers, U.S. city average (CPI-U). Retrieved October 24, 2019, from https://beta.bls.gov/dataViewer/view/timeseries/SUUR0000SA0;jsessionid=B4563C163FD84ECF5D4D7C657B471472
- Employment, hours & earnings (CES). (2019). STATS Indiana. Retrieved October 24, 2019, from www.stats.indiana.edu/ces/ces_naics/.
- Labor force time series (NSA). (2019). STATS Indiana. Retrieved October 7, 2019, from www.stats.indiana.edu/laus/laus_view3.html
- State leading indexes. Federal Reserve Bank of Philadelphia. Retrieved on November 1, 2019, from www.philadelphiafed.org/research-and-data/regional-economy/indexes/leading/
- Surveys of consumers. The University of Michigan. Retrieved October 8, 2019, from www.sca.isr.umich.edu/
- See note 9.
- Tong, S. (2017, March 24). Marketplace.org. When it comes to NAFTA and autos, the parts are well traveled. Retrieved from www.marketplace.org/2017/03/24/world/when-it-cones-nafta-and-autos-parts-are-well-traveled
- October 2019 manufacturing ISM report on business. Institute for Supply Management.
- Rappeport, A., Swanson, A., & Phillips, M. (2019, September 18). Fed cuts interest rates by another quarter point. The New York Times. Retrieved from www.nytimes.com/2019/09/18/business/economy/fed-interest-rate-cut.html
- Benzoni, L., Chyruk, O., & Kelley, D. (2018). Why does the yield-curve predict recessions? Chicago Fed Letter. No. 404. Retrieved from www.chicagofed.org/publications/chicago-fed-letter/2018/404
- Cox, J. (2019, October 8). The father of the yield curve indicator says now is the time to prepare for a recession. CNBC. Retrieved from www.cnbc.com/2019/10/08/inverted-yield-curve-guru-campbell-harvey-prepare-for-recession.html
- Scotiabank. (2019, June 30). Number of cars sold worldwide from 1990 to 2019 (in million units) [Graph]. Statista. Retrieved October 7, 2019, from www.statista.com/statistics/200002/international-car-sales-since-1990/
- IHS Markit. (2019, June 27). Average age of cars and light trucks in U.S. rises again in 2019 to 11.8 years, IHS Markit says. IHS Markit. Retrieved from https://news.ihsmarkit.com/press-release/automotive/average-age-cars-and-light-trucks-us-rises-again-2019-118-years-ihs-markit-
- Calculations conducted by Dr. Ryan Brewer (2019).
- The World Bank data in this section was retrieved October 23, 2019, from www.worldbank.org/en/publication/global-economic-prospects.
- See note 9.
- Lazick, R. S., & Burton III, V. L. (2018). Top commercial diesel engine makers, 2016. Market Share Reporter, 29. Retrieved from http://link.galegroup.com/apps/doc/RYJXWL955813157/GDL?u=iulib_iupui&sid-GDL&xid-44090b75
- Cummins, Inc. (2019, October 29). Cummins announces third quarter results. Cummins. Retrieved from https://investor.cummins.com/news-releases/news-release-details/cummins-announces-third-quarter-results
- Kolinski-Morris, E. (2019, May 31). Global economic and industry update. Slides presented at the 26th Annual Automotive Outlook Symposium, Detroit, MI. Retrieved from www.chicagofed.org/~/media/others/events/2019/automotive-outlook-symposium/morris-05312019-pdf.pdf


