
Indiana’s outlook for 2020

Associate Professor of Finance, Indiana University Division of Business, Indiana University–Purdue University Columbus

Economic Research Analyst, Indiana Business Research Center, Kelley School of Business, Indiana University Bloomington
Outlook
Amid mixed leading signals and a turbulent news cycle, we expect Indiana’s economic output to grow at a rate of about 1.25 percent in 2020.
Sustained growth is expected, largely due to continued strong consumer spending countervailed by weakness in manufacturing. Business investments have not met expectations from the 2018 tax cuts, and corporations have been conducting stock buybacks rather than capital purchases. As the trade war with China continues and the global expansion is slowing down, the Institute for Supply Management (ISM) reports that manufacturers have confirmed a point of contraction—with three consecutive reports each below 50. This is unseen since the beginning of the Great Recession. The September 2019 report1 came in at 47.8 while October remained below 50 with a reading of 48.3.2
Automobile and light truck sales in the U.S. are expected to drop from 16.8 million units in 2019 to 16.4 million units in 2020, a decline of about 2 percent.3 Indiana will experience a more significant decline than the U.S. as a whole, since Indiana is a heavy manufacturing state with its supply chain entrenched solidly within the automotive sector.
Consumer spending strengthened in recent years due to wage increases across the country, particularly in Indiana, which could result in inflationary pressure. However, the latest information suggests continued wage growth may stall.4 The Federal Reserve has been dovish of late, with cuts to the federal funds rate of 75 basis points thus far in 2019. These cuts should help keep lease rates and other financing options in check, reinforcing demand for automobile and light truck purchases.
Indiana is expected to experience slower job growth and gross output due to a tight labor market. In September 2019, the unemployment rate in Indiana was at 3.2, lower than the U.S. rate of 3.5 percent.5 Furthermore, Indiana’s labor force participation rate (64.5 percent) is higher than the U.S. (63.2 percent). With fewer and fewer people available to hire, the tightness of the Indiana labor markets will serve as a drag on output and employment growth.
GDP growth and employment
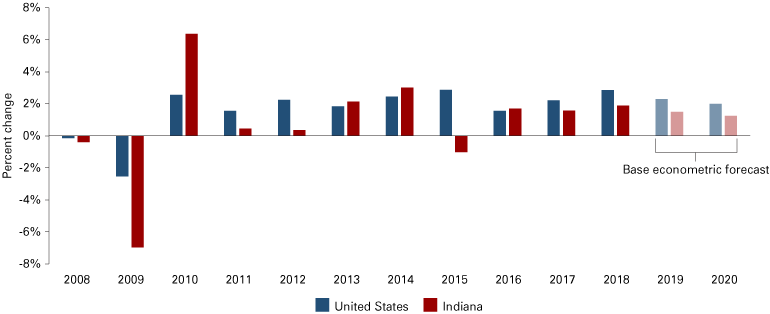
Figure 1 shows the relationship between real annual Indiana gross state product (GSP) and U.S. gross domestic product (GDP) growth from 2008 to 2018, with projections for 2019 and 2020. Based on a conservative forecast, the inflation-adjusted U.S. GDP growth in 2019 would finish at 2.3 percent, a 0.6 percent decline from 2018.6 We calculate the most recent annualized quarter-over-quarter real growth rate for the U.S. to be 3.2 percent and 1.3 percent for Indiana. The most current data available (through the first quarter of 2019) indicate U.S. output growth has been higher than Indiana’s growth rate for four consecutive quarters.7
Figure 1: Growth in Indiana gross state product and U.S. gross domestic product
Source: U.S. Bureau of Economic Analysis and the Indiana University Center for Econometric Model Research
Two factors could be causing slow growth in Indiana: a reliance on manufacturing, which is said to be in contraction, and tight labor markets. Each of these reasons is explored below.
Indiana industries
The majority of Indiana’s private sector runs on manufacturing (with output of 28 percent—17 percent durable and 11 percent nondurable), followed by financial services (15 percent), professional and business services (9 percent), and health care (8.5 percent). The government sector also produces about 8 percent of output.8
Over the past year, various media have reported conflicting information about the extent of impacts from tariffs on imports and exports in America. Thus, any attempt to accurately quantify the impact of the current trade war on the Indiana economy at this point, would be impossible. With an ongoing trade war across countries and the possible ratification of the new trade deal, the United States-Mexico-Canada Agreement (or NAFTA 2.0), Indiana’s manufacturing and farming industries will be affected.
Key industries and the ongoing trade war
Manufacturing
Historically, Indiana has been the leading state in the manufacturing sector for at least two good reasons. First, Indiana has been the front-runner in manufacturing output since 1997 (though Louisiana did rank first from 2004-2006). Secondly, with the exception of one year (2009), Indiana has led the nation in manufacturing employment since 1996, when Indiana took the manufacturing mantle from North Carolina (see Table 1).9
Table 1: Manufacturing’s share of nonfarm employment, 2018
| Rank | State | Percent of total |
|---|---|---|
| 1 | Indiana | 17.2% |
| 2 | Wisconsin | 16.0% |
| 3 | Michigan | 14.3% |
| 4 | Iowa | 14.1% |
| 5 | Alabama | 13.1% |
Source: National Association of Manufacturers
While nearly one in every five Indiana jobs is in manufacturing, the overweighting in the manufacturing sector is even more pronounced in terms of GSP. Indiana continues to easily lead the nation in manufacturing output (around 28 percent of GSP), with second-place Louisiana coming in around 22 percent (see Table 2).
Table 2: Manufacturing’s share of real GSP, 2018
| Rank | State | Percent of Total |
|---|---|---|
| 1 | Indiana | 27.7 % |
| 2 | Louisiana | 21.7 % |
| 3 | Michigan | 18.9 % |
| 3 | Wisconsin | 18.9 % |
| 5 | Kentucky | 18.5 % |
Source: STATS Indiana, using U.S. Bureau of Economic Analysis data
The dependence of the Indiana economy on manufacturing presents three potential consequences.
- Since Indiana manufactures many more products than other states, a trade war would decrease exports to foreign countries. This would harm both employers and employees.
- With our reliance on manufacturing 11 years into the current cyclical expansion, we have tight labor markets and very little slack, which diminishes prospects for employment growth.
- With a slowing of output and the nature of cyclical manufacturing, Indiana will likely experience a higher rate of economic decline.
Farming
In 1950, Indiana was home to 166,627 farms, with more than 157,000 operators. Today, Indiana is home to fewer than one-third of that many farms and farming operations.10 In 1977, gross output from farming in Indiana comprised 3.4 percent of the state economy. As of 2017, the amount had dropped to 2.3 percent of the economy, with output of $4.4 billion. It is apparent that farming as a fraction of the economy in Indiana has shrunk over the decades. Yet, Hoosier farmers (totaling over 94,000 in 2017) as individuals are certainly affected by the trade war.11 According to the Indiana State Department of Agriculture (2019), Indiana was the eighth-largest agricultural exporter in the country as of 2017, the 10th-largest farming state, and in the top five among U.S. states that produce ducks, popcorn, ice cream, tomatoes, pumpkins, turkeys, corn, soybeans, watermelons and hogs. Even so, farming accounts for a relatively small number of jobs available to Hoosiers and has been declining for many decades. Thus, farming is not an accurate representative to gauge our economic condition in the near future. However, for the 94,000 farmers among us, the trade war is quite real.
At the end of the day, the main driver of the Indiana economy is manufacturing. During expansions we thrive, and during contractions we hurt.
Employment
Indiana is at full employment and expects to remain that way through the end of 2020. Indiana’s unemployment rate (U-3) for September 2019 was at 2.8 percent (not seasonally adjusted)—or 3.2 percent (seasonally adjusted). Indiana’s 2.8 percent unadjusted rate compares to the U.S. unadjusted rate of 3.3 percent, which is down from 3.6 percent a year ago. Seasonally adjusted or not, these figures are well below the gauge for full employment, which can be thought of as the lowest level of U-3 that does not cause inflation.12 Because we have moved well past the level of full employment, with unemployment rates at 50-year lows, wages have been rising.
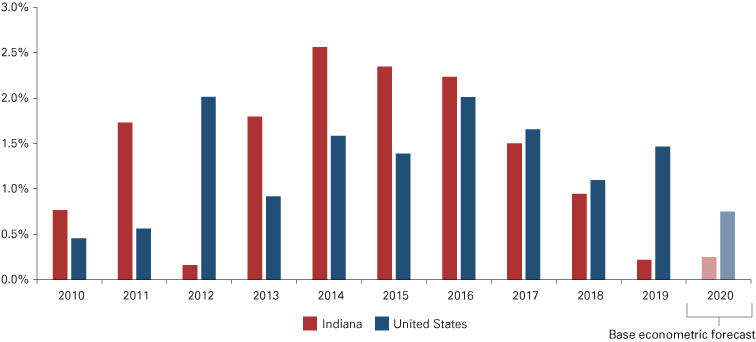
In spite of the tight labor markets in Indiana, the results for 2019 are expected to support slight positive gains with respect to jobs—filled and created. Moving into 2020, job growth in Indiana is expected to continue to lag behind the U.S. as a whole (see Figure 2), as the expansion seeks productivity gains through capital investments as labor shortages increase.
Figure 2: Employment growth econometric forecast
Source: U.S. Bureau of Labor Statistics and the Indiana University Center for Econometric Model Research
Labor force
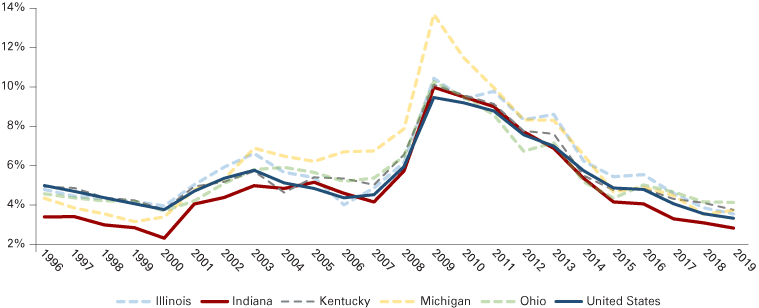
Next, we assess Indiana’s historical unemployment rates compared to neighboring states. Figure 3 illustrates that Michigan has more cyclical change in the unemployment rate than others, due to its overweighted connections to the automotive supply chain. From the figure, Indiana also shows more cyclical changes than the U.S. as a whole.
Figure 3: September unemployment rates for Indiana and neighboring states
Source: STATS Indiana, using U.S. Bureau of Labor Statistics data
As of September 2019, Indiana’s unemployment rate stood lower than its neighboring states. However, unemployment rates only tell part of the employment story in a given region.
Indiana has a history of lags in educational attainment. The jobs tailored to certain demographics are thus prone to recessionary contractions. Wages are on the low end, and the overall economic structure is less capable of expanding at times of peak employment (like now).13 Thus, in future periods, particularly periods of economic contraction, Hoosiers stand cyclically vulnerable compared to other states. This is of particular concern now, as the economic expansion continues forward in time longer than ever before.
Indiana also lags behind peer states in business investment, measured by venture capital investment. Both characteristics—higher educational attainment and venture capital investment—illustrate opportunities for Hoosier leaders. With positive change, Indiana could drive its labor force in a direction better suited to acclimate to the inevitability of cyclical unemployment turbulence. Artificial intelligence, robotics and a host of other important areas will increasingly become the topics of economic opportunity and the main drivers in business investment, while freeing production demands from labor pools that are unavailable.
Alongside a low U-3 rate, Indiana holds a high labor force participation rate (LFPR) compared to its peers and the nation overall. At 64.5 percent, Indiana’s LFPR remains higher than most of its manufacturing-heavy peer states; however, Indiana still has not recovered to the labor force participation rates it had before the Great Recession (see Figure 4).
Figure 4: Labor force participation rates among manufacturing-heavy peer states
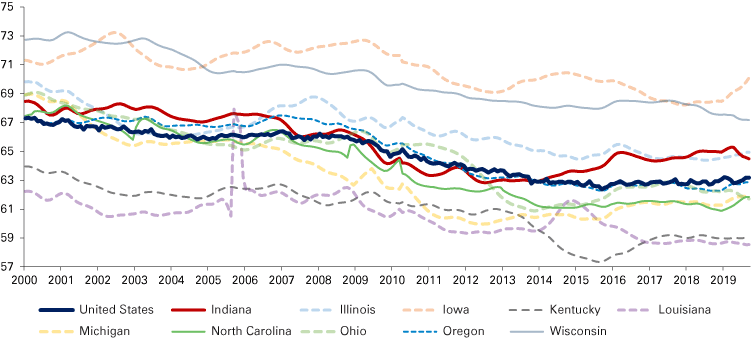
Note: The LFPRs are calculated for the population ages 16 and older.
Source: U.S. Bureau of Labor Statistics
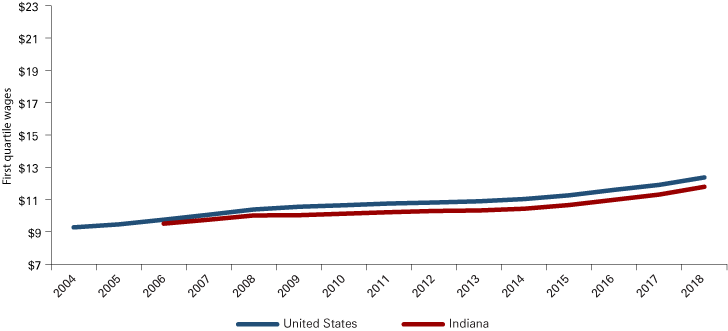
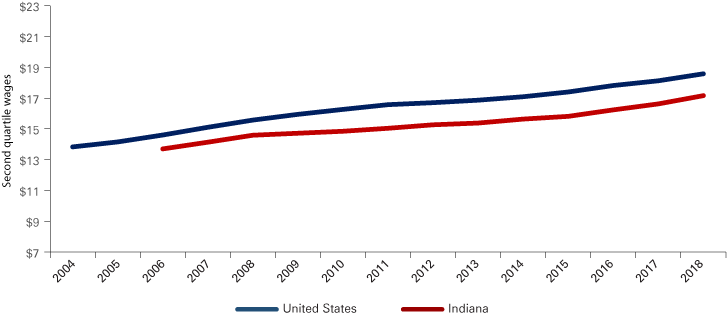
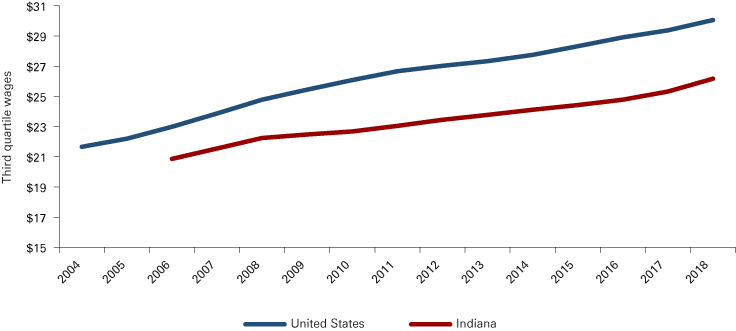
While the LFPR lags behind rates seen 15 years ago, the questions about wage increases still remain valid. The new LFPR may represent a new level of full employment because of the aging population and a lack of fitness or desire with respect to work-readiness. Furthermore, if wages are rising in Indiana, what level of jobs have been seeing the increases? To answer this question, we analyzed wages over time (2004-2018) within quartiles of the labor pool in Indiana. Figures 5, 6, and 7 address this point.14
Figure 5 reflects that wages in Indiana within the first quartile of wage earners started lower and have increased slightly more slowly than the U.S. as a whole. Between 2009 and 2014, wages at this level were relatively flat but have accelerated upward since 2015.
Figure 5: First quartile wages over time
Source: Indiana Department of Workforce Development
From Figure 6, we can see that wages in the second quartile of earners increased slowly during the recovery period and have been accelerating since 2015. Again, the U.S. as a whole started higher and has marched forward with a slightly faster growth rate overall in this second quartile.
Figure 6: Second quartile wages over time
Source: Indiana Department of Workforce Development
Figure 7 shows additional evidence that over the past 15 years, wages across the U.S. have risen faster than wages in Indiana.
Figure 7: Third quartile wages over time
Source: Indiana Department of Workforce Development
From the figures, we notice the consistency of recent acceleration in wages since 2015, and that the U.S. average quartile wage levels have been consistently above those of Indiana. Yet perhaps a bigger question is, why have wages in the U.S. outpaced wages in Indiana?
A possible answer is innovation, which derives from the educational attainment level of the relevant labor force. Thus, while Indiana has a relatively tight labor market—which drives up wages during an expansion, Indiana also has a relatively poorly educated workforce, which would drive wages down compared to the U.S.15 Innovation is considered below.
Innovation measured by venture capital
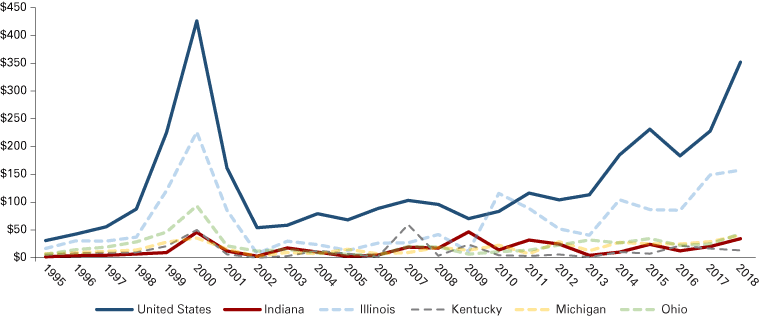
In this section, a relative comparison of capital investment in Indiana was made to neighboring states to see how we stack up (see Figure 8).
Figure 8: Amount of venture capital dollars per capita in U.S. and neighboring states
Note: Data are in 2017 dollars.
Source: StatsAmerica
Typically, venture capital is invested in forward-looking technologies that have the capacity to drive strong growth and to yield excess earnings, which in turn drive wages higher. These deals are exciting as they bring the promise of cutting-edge work requiring specialized knowledge and human capital. All of these attributes would move Indiana forward, as the state lags behind our neighbors in venture capital dollars invested.
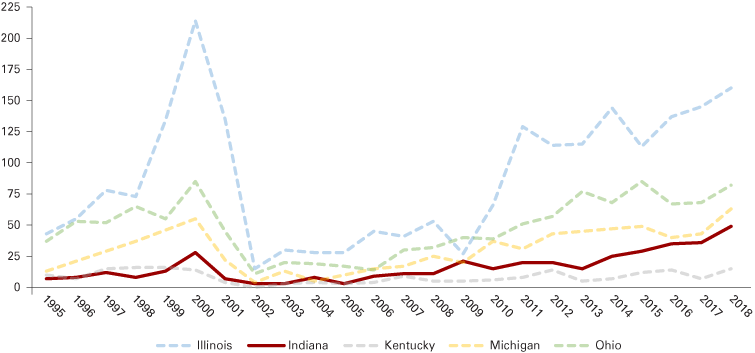
There might be a silver lining here, however. Indiana is only significantly outpaced in terms of venture capital dollars by Illinois here in the Midwest. Figure 9 shows that firms in Indiana have landed nearly as many VC deals as Michigan, and the trajectory is clearly upward in direction from 2013 to 2018. Investments in innovation and human capital are certainly part of the answer to where we should go from here, and moving in the right direction is a key first step.
Figure 9: Number of venture capital deals among neighboring states
Source: StatsAmerica
Risks
Should the national economy slow more than expected in 2020, Indiana could experience negative growth. Risks to growth in Indiana include the following:
- Consumers begin to listen to the recession chatter and delay large purchases, dampening growth rates in sales of new automobiles and light trucks. This could cost Hoosiers jobs. While this outcome is not the expectation, it stands as a viable risk.
- Various political or policy issues relating to the trade war are harmful to growth in Indiana.
Notes
- Patch, J. E., Frohlich, M. T., & Jones, S. L. (2019). 2019 Indiana manufacturing survey: Labor shortages hit home. Published and underwritten by Katz, Sapper & Miller, and republished by Indiana University. Retrieved from https://www.ksmcpa.com/insights/2019-indiana-manufacturing-survey-labor-shortages-hit-home/
- Cahill, K. (2019, November 1). October 2019 Manufacturing ISM report on business. Institute for Supply Management.
- Wall, M. (2019, February). Automotive industry outlook: Managing volatility and leveraging opportunities in a dynamic market environment. IHS Markit. Retrieved from www.cargroup.org/wp-content/uploads/2019/02/Wall.pdf
- Irwin, N. (2019, November 1). Jobs are plentiful. Big pay raises aren’t. The New York Times. Retrieved from www.nytimes.com/2019/11/01/upshot/jobs-are-plentiful-big-pay-raises-arent.html
- The October unemployment rate for the U.S. has been reported to be 3.6 percent, while state numbers for October were not yet released at the time of this writing. Visit the U.S. Bureau of Labor Statistics at www.bls.gov/lau/.
- Economic growth in early 2019 was stronger than expected. (2019, April 29). Peter G. Peterson Foundation. Retrieved from www.pgpf.org/blog/2019/04/economic-growth-remains-strong-but-it-probably-wont-last
- Authors’ calculations, using data from the U.S. Bureau of Economic Analysis, 2019.
- Brewer, R. M. (2018, Winter). Indiana’s outlook for 2019. Indiana Business Review. Retrieved from www.ibrc.indiana.edu/ibr/2018/outlook/indiana.html
- U.S. Bureau of Economic Analysis data accessed on October 27, 2019. Retrieved from https://apps.bea.gov/itable/iTable.cfm?ReqID=70&step=1
- Hall, T. (2010, May-June). The importance of Indiana agriculture. InContext. Retrieved from www.incontext.indiana.edu/2010/may-june/article3.asp
- About Indiana agriculture. (n.d.). Indiana State Department of Agriculture. Retrieved from www.in.gov/isda/3555.htm
- Crook, C. (2018, July 6). Quicktake: Full employment. Bloomberg. July 6, 2018. Retrieved from www.bloomberg.com/quicktake/full-employment
- Brewer, R. M. (2017, Winter). Indiana’s outlook for 2018. Indiana Business Review. Retrieved from www.ibrc.indiana.edu/ibr/2017/outlook/indiana.html
- Indiana Department of Workforce Development data accessed on October 28, 2019. Retrieved from www.hoosierdata.in.gov/dpage.asp?id=24&view_number=3&menu_level=&panel_number=2
- Refer to Figure 5 in Brewer, R. M. (2017, Winter). Indiana’s outlook for 2018. Indiana Business Review. Retrieved from www.ibrc.indiana.edu/ibr/2017/outlook/indiana.html


