Fort Wayne forecast 2020

Director of the Community Research Institute, Purdue University Fort Wayne

Assistant Professor of Economics, Purdue University Fort Wayne
Fort Wayne has enjoyed solid employment as a result of the extended economic expansion. However, the question of an economic contraction is not if but when, since this is the nature of the business cycle. Regardless, recessions aren’t kind to Fort Wayne’s economy, especially as it relates to local private-sector employment. Since labor force numbers are a lagging indicator, it is possible to have solid employment at the start of a recession, as shown in Figure 1.
Figure 1 reflects the total annual private-sector employment in the Fort Wayne MSA from 2001 to 2018, which includes two official recessions: 2001 and 2008-2009. These numbers reflect the location of the job, not where employees live. Labor force numbers, which are used for the unemployment forecasts, reflect the location of the employee.1
Figure 1: Fort Wayne MSA private-sector employment

Source: U.S. Bureau of Labor Statistics Quarterly Census of Employment and Wages
Fort Wayne lost about 8.7 percent of its private-sector jobs from 2007 to 2010, going from 185,686 to 169,610 positions. It didn’t match pre-recession jobs until 2016, a full seven years from the official end of the last recession.
Manufacturing, education and health services in Fort Wayne
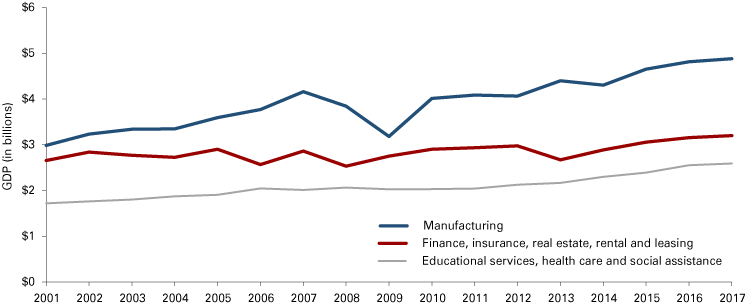
Manufacturing continues to play a central role in Fort Wayne’s economy, both in terms of productivity and employment. Looking at Fort Wayne’s gross domestic product (GDP) in 2009 chained dollars, manufacturing has been and continues to be the most productive industry as measured by GDP (see Figure 2).
Figure 2: Fort Wayne MSA GDP for select industries in 2009 chained dollars

Source: U.S. Bureau of Economic Analysis
In 2001, manufacturing constituted 18.6 percent of Fort Wayne’s GDP. By 2017, it was up to 24.7 percent, just down from 24.8 percent in 2016. In contrast, the education, health care and social assistance sector consisted of just over 13 percent in 2017. Finance, insurance and real estate constituted 16.2 percent of local GDP in 2017. (The 2018 GDP numbers—slated for release in December 2019—were unavailable at the time of this writing).
Switching to employment, of the Fort Wayne MSA’s 190,807 private-sector jobs in 2018, 36,828 positions were in manufacturing—or more than 19 percent—according to U.S. Bureau of Labor Statistics (BLS) Quarterly Census of Employment and Wages data. For Indiana, 541,836 manufacturing positions made up just over 20 percent of the state’s private-sectors jobs.
Whether the number of manufacturing jobs has rebounded depends on when one starts counting. Looking at the end of the Great Recession in 2009 to 2018, Fort Wayne’s manufacturing jobs increased 20.5 percent, going from 30,573 to 36,828 jobs, according to BLS data.
Stepping back to the 2001 dot-com recession, Fort Wayne had 40,772 manufacturing jobs, translating to a 9.7 percent decrease from last year’s total. No one was complaining about too many manufacturing jobs in 2001. However, comparing manufacturing employment to manufacturing productivity, Fort Wayne keeps making more goods when measured by GDP. In other words, the loss of jobs hasn’t translated into fewer goods. Fort Wayne’s manufacturing sector is truly a study in doing more with less as measured by jobs and GDP.
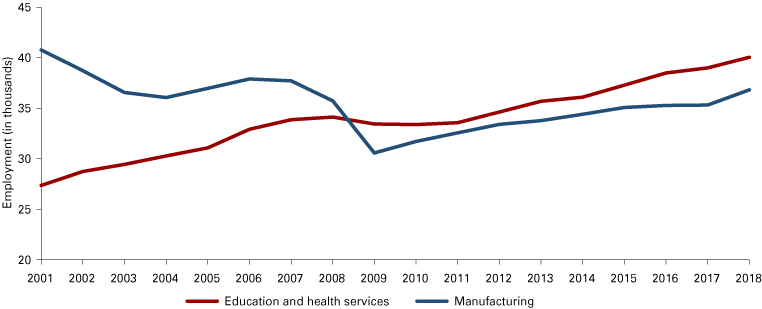
Education and health services supplanted manufacturing as the largest employment industry for the private sector in 2009 and has continued a steady upward climb. In 2018, Fort Wayne had 40,041 positions in education and health services, constituting nearly 21 percent of Fort Wayne’s jobs and making it the largest sector by number of jobs.
Figure 3 shows the annual number of manufacturing and education and health services jobs in the Fort Wayne MSA, the two largest industries, from 2001 through 2018.
Figure 3: Fort Wayne MSA private-sector employment for manufacturing and education and health services

Source: U.S. Bureau of Labor Statistics Quarterly Census of Employment and Wages
While manufacturing employment took a significant dip during the Great Recession and is close to pre-recession numbers, education and health services has continued with essentially a steady upward climb for close to 20 years. This service sector declined by just under 700 jobs between 2008 and 2009, then remained essentially level through 2011, and went up every year after that.
Fort Wayne outlook
With the national and local economy being interrelated, what’s happening across the globe easily affects Fort Wayne. At the end of 2019, the leading indicators for the national economy show signs of slowing down. The start-up level of new businesses less than one year of age only increased by 0.79 percent year-over-year according to Statista.com. The Producer Manufacturing Index (PMI) is contracting, which is most likely due to supply-chain interruptions caused by the trade wars. Nationally, new housing starts increased in August 2019 by 7.4 percent year-over-year, but it only increased by 2.9 percent in September 2019 year-over-year. Total construction spending decreased by 1.9 percent year-over-year. Advance retail sales are showing signs of slowing since they grew by 4.0 percent year-over-year in September 2019—down from 4.6 percent year-over-year in August.
In terms of national recession forecasts, the Federal Reserve of New York’s prediction of a recession using the yield curve has spiked to 34.8 percent in September 2020. The Federal Reserve of Cleveland’s measure, which also uses the yield curve to predict recessions, indicates that the probability of a recession in August 2020 spikes to 43.0 percent, but it decreases to 31.0 percent in October 2020.
The yield curve is a leading economic indicator. The spread between the 10-year and three-month Treasury bill was negative from May 2019 until October 10, 2019, which is unprecedented. This indicates that the market expects more uncertainty and volatility in the near term.
For the Fort Wayne MSA, the model in Figure 4 (using seasonally adjusted numbers2) forecasts the change in the unemployment rate to decrease between -0.04 percent to -0.01 percent from September 2019 to December 2020.3 The standard error bands range from 0.17 percent to 0.19 percent from September 2019 to December 2020.4 These provide the spread, i.e., the range of the forecasts. In August 2019, the unemployment rate was 3.0 percent. Based on this model, the Fort Wayne MSA’s unemployment rate should not deviate greatly until the end of 2020—provided there is no large shock to the economy. If the economy continues as is, the Fort Wayne MSA unemployment rate could range between 2.8 percent and 3.2 percent in 2020, staying well within the full-employment range. In other words, the tight labor market that favors workers could continue for yet another year.
Figure 4: Unemployment rate forecasts for the Fort Wayne MSA

Source: Modeling by Purdue University Fort Wayne, using historic data from the Federal Reserve Bank of St. Louis
Unemployment and labor force numbers are typically lagging indicators since the elimination of jobs is often a last resort in lean economic times. Therefore, the predictions for unemployment may not identify when a recession is imminent. However, looking at the applied side of economics, the model is consistent with what has been happening in Fort Wayne over the past few years. The labor force remains at full employment (i.e., less than 5 percent unemployment). It can absorb new workers as baby boomers leave the workforce and new jobs are created in a variety of sectors, including manufacturing.
With so many uncertainties on the global and national horizons (including the effects of the trade war, a global economic slowdown, sluggish productivity, and the widening gap between productivity and wages) and with Fort Wayne not existing in an economic vacuum, it is harder to predict exactly when Fort Wayne’s economy will be affected. It is almost as if the northeast corner of Indiana is waiting for the other shoe to drop. In the meantime, Fort Wayne’s workers and employers should hope for the best, but prepare for the worst.
Notes
- Labor force numbers, as released by the Indiana Department of Workforce Development, count people by where they live, not where they work.
- The Indiana Department of Workforce Development’s monthly unemployment statistics for local areas—counties, cities and metro areas—are not seasonally adjusted; thus, one can expect a greater variation on the released numbers in 2020 than the model forecasts.
- To model the unemployment rate, the monthly seasonally adjusted unemployment data for Fort Wayne MSA is used. Based upon the Augmented Dickey-Fuller-Generalized Least Squares (ADF-GLS) Unit Root Test, as developed by Elliott, Rothenberg, and Stock in 1992, the unemployment rate data is found to contain a unit root, so the first difference of unemployment rate is used in the regression analysis. To model the first difference of the unemployment rate, the autocorrelation function (ACF) and the partial autocorrelation function (PACF) are used once the first difference in unemployment is found to be stationary, which determines the model to be an AR(2). Based on the AR(2) model, the s-step ahead forecasts are constructed from September 2019 to December 2020.
- To avoid a distributional assumption on the forecasts, the s-step ahead forecasts are presented using only the standard errors. Confidence intervals are not calculated since a pre-specified critical value needs to be provided, which typically is the 95 percent normal critical value of 1.96. The Jarque-Bera Test rejects the null of normality at the 95 percent significance level for the first difference of the unemployment rate. Hence, only the standard error bands are presented for the forecasts of the first difference of the unemployment rate.


