South Bend and Elkhart forecast 2020

Director of the Bureau of Business and Economic Research and Associate Professor of Economics, Judd Leighton School of Business and Economics, Indiana University South Bend
After eight years of expansion, it seems that the regional economy slowed down in 2019. The South Bend-Mishawaka Metropolitan Statistical Area (MSA) may likely see a modest increase in its aggregate production in 2019 and has experienced a smaller increase in the labor force and employment than in 2018.1 Elkhart-Goshen’s economic growth was subdued in the first eight months of 2019, accompanied by a rising unemployment rate.
Labor force and employment
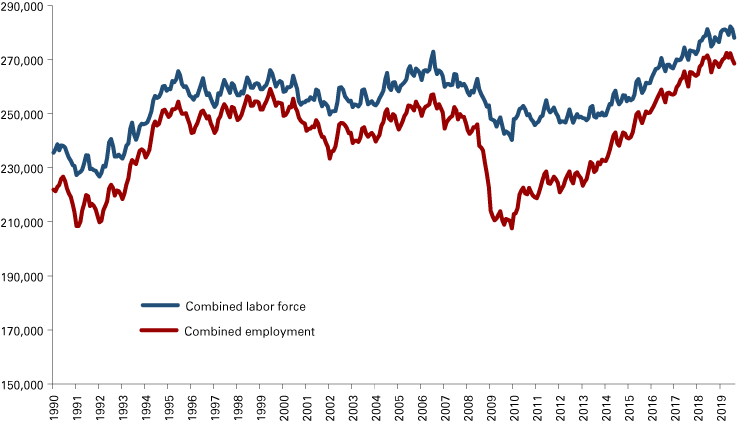
The monthly trends of the labor force and employment are presented in Figure 1.2 The labor force in the combined regions averaged 280,533 between January and August 2019, an increase of 3,004 workers from January-August 2018. Broken down by MSAs, the statistics show that South Bend-Mishawaka added 2,064 workers and Elkhart-Goshen added 940 workers to their labor forces, respectively. Although the labor force of the combined regions still expanded in 2019, its increment is only half that of 2018, indicating slower growth in the region. Furthermore, South Bend-Mishawaka outpaced its neighbor area in the labor force growth rate for the first time since 2010 when the economic recovery began. Meanwhile, this is also the smallest gain of the labor force in Elkhart-Goshen in the past eight years.
Employment in the combined regions averaged 270,515 for the first eight months of 2019, a modest increase of 1,947 workers from 2018. The increment of employment was 1,733 workers (+1.1 percent) in South Bend-Mishawaka and 214 workers (+0.2 percent) in Elkhart-Goshen. For Elkhart-Goshen, this is the smallest job gain since 2012. South Bend-Mishawaka also saw the smallest job gains in recent years. The employment growth rate of South Bend-Mishawaka outpaced that of the U.S. (1.0 percent) and Indiana (0.6 percent); whereas, Elkhart-Goshen fell below the national and state rates on this measure.
Figure 1: Labor force and employment in the Elkhart-Goshen and South Bend-Mishawaka MSAs combined, January 1990 to August 2019

Note: Data are not seasonally adjusted.
Source: STATS Indiana, using U.S. Bureau of Labor Statistics data
Unemployment
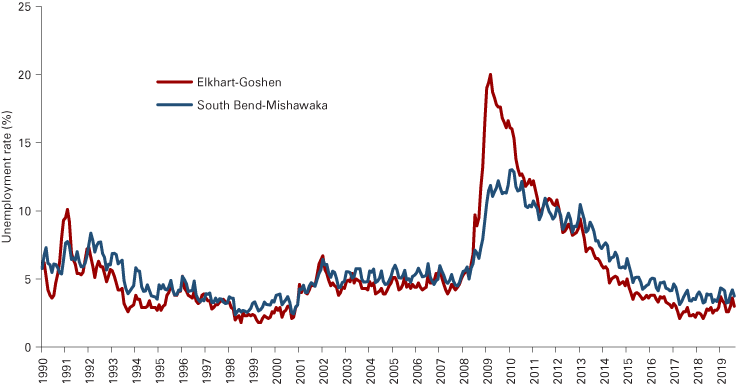
Figure 2 displays the unemployment rates in the Elkhart-Goshen and South Bend-Mishawaka MSAs from January 1990 to August 2019. The average monthly unemployment rate of South Bend-Mishawaka was 3.9 percent for year-to-date 2019, little changed from the average rate of 3.7 percent in 2018 because the labor force and employment increased at about the same pace. However, the unemployment rate in Elkhart-Goshen increased due to labor force expansion outpacing employment. The average monthly unemployment rate rose by 0.6 percentage points to 3.1 percent during the first eight months of 2019. This is the first time either area has seen an increase of the average unemployment rate in the most recent nine years.3
Nevertheless, Elkhart-Goshen’s jobless rate is still below the U.S. average unemployment rate of 3.8 percent and the Indiana average rate of 3.5 percent for January-August 2019. Yet, the unemployment rate in the South Bend-Mishawaka area was above both the state and national rates.
Figure 2: Unemployment rate in the Elkhart-Goshen and South Bend-Mishawaka MSAs, January 1990 to August 2019

Note: Data are not seasonally adjusted.
Source: STATS Indiana, using U.S. Bureau of Labor Statistics data
Employment by industry
Table 1 presents the average monthly employment by industry in Elkhart-Goshen, South Bend-Mishawaka, and the combined regions from January to August 2019 and the changes from the same period in 2018.
As shown in Table 1, the monthly total nonfarm employment in the combined regions averaged 286,913 in January-August 2019, adding 2,238 workers from 2018. Natural resources, mining and construction saw the most job increase (+1,063 jobs), followed by leisure and hospitality (+575 jobs), private educational and health services (+338 jobs), other services (+250 jobs), and government (+213 jobs).
In South Bend-Mishawaka, total nonfarm employment rose by 1,838 workers in 2019, stronger growth than in 2017 and 2018. The most significant job gains occurred in natural resources, mining and construction (+738 jobs), government (+563 jobs), and manufacturing (+300 jobs). Smaller job increases were observed in leisure and hospitality (+150 jobs), other services (+150 jobs), and private educational and health services (+100 jobs).
However, Elkhart-Goshen only added an average of 400 workers to its nonfarm sectors in the first eight months of 2019. Elkhart-Goshen saw modest job growth in leisure and hospitality (+425 jobs), natural resources, mining and construction (+325 jobs), and private educational and health services (+238 jobs). Manufacturing, which used to be the major driving force of job growth in Elkhart-Goshen, has an average monthly employment of 70,788 in January-August 2019, shedding an average of 475 jobs. This is the first time in nine years that manufacturing jobs have declined in Elkhart-Goshen. Meanwhile, government experienced a decline of 350 workers on average.
Table 1: Year-to-date employment by industry and metro area
| Elkhart-Goshen | South Bend-Mishawaka | Combined MSAs | ||||
|---|---|---|---|---|---|---|
| Industry | Employment in 2019 | Change since 2018 | Employment in 2019 | Change since 2018 | Employment in 2019 | Change since 2018 |
| Total nonfarm | 142,700 | 400 | 144,213 | 1,838 | 286,913 | 2,238 |
| Natural resources, mining and construction | 4,113 | 325 | 6,250 | 738 | 10,363 | 1,063 |
| Manufacturing | 70,788 | -475 | 18,138 | 300 | 88,925 | -175 |
| Trade, transportation and utilities | 20,388 | 50 | 25,413 | -38 | 45,800 | 13 |
| Information | 400 | 0 | 1,475 | 13 | 1,875 | 13 |
| Financial activities | 2,938 | 13 | 5,525 | -50 | 8,463 | -38 |
| Professional and business services | 10,963 | 75 | 13,713 | -88 | 24,675 | -13 |
| Private educational and health services | 12,325 | 238 | 35,963 | 100 | 48,288 | 338 |
| Leisure and hospitality | 8,150 | 425 | 15,075 | 150 | 23,225 | 575 |
| Other services | 4,200 | 100 | 6,963 | 150 | 11,163 | 250 |
| Government (includes public schools and hospitals) | 8,438 | -350 | 15,700 | 563 | 24,138 | 213 |
Note: Data are for January through August 2019.
Source: STATS Indiana, using Current Employment Statistics (CES) data from the U.S. Bureau of Labor Statistics
Local wages and hours worked
The local labor market is still tight in 2019. Average hourly earnings for all employees on private nonfarm payrolls were $23.87 and $24.29 in Elkhart-Goshen and South Bend-Mishawaka, respectively, in 2019—about 2 percent higher from 2018. The average workweek for all employees went up by 1.6 percent to 36.7 hours in Elkhart-Goshen and by 1.3 percent in South Bend-Mishawaka to 34.9 hours over the first eight months in 2019. Consequently, the average weekly earnings rose by 3.7 percent to $876 in Elkhart-Goshen and by 3.4 percent to $848 in South Bend-Mishawaka, respectively.
Housing
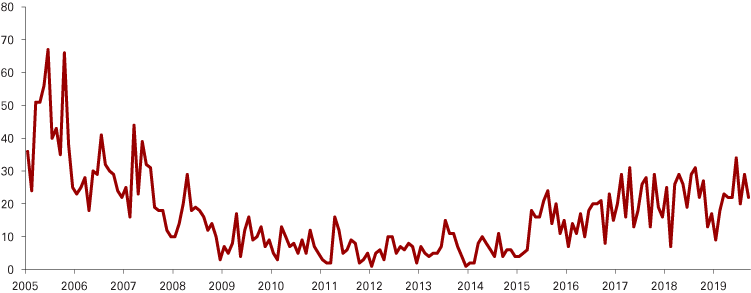
The housing market expansion in St. Joseph County seemed to decelerate in 2019. There was a total of 177 new single-family building permits issued (an indicator for new residential construction) in January-August 2019. This figure was down 7.8 percent from 2018 (see Figure 3). Although St. Joseph County saw a decline in new home construction for the first time in five years, it still issued the third-highest number of building permits since 2008. However, the peak level before the Great Recession has never been recovered (e.g., 229 permits were issued in the first eight months of 2007).
Statistics from the Indiana Association of Realtors also indicated a cooldown in St. Joseph real estate transactions in 2019.4 The year-over-year analysis shows that the cumulative number of newly listed houses for sale from January-August 2019 was 0.2 percent higher, yet the cumulative number of closed sales declined 1.9 percent. Meanwhile, the median sale price was up 7.2 percent.
Figure 3: Single-family residential building permits in St. Joseph County, January 2005 to August 2019

Source: St. Joseph County Building Department
Summary
The recreation vehicle (RV) industry is the pillar of the Elkhart-Goshen economy. According to RV Industry Association statistics, total shipments declined 4.1 percent in 2018 from the 2017 record.5 Furthermore, RV shipments have fallen 20 percent cumulatively in January-August 2019 from 2018.6 More than 50 percent of the recreation vehicles sold in the U.S. are produced in Elkhart-Goshen. The decline in RV sales plus a slowdown in the nation’s auto sales signals a downturning economy, especially for Elkhart-Goshen (Burris, 2019).
In 2020, more negative factors will confront the Elkhart-Goshen economy. Higher tariffs already increase the production cost of RVs. The ongoing trade war with China will likely further affect RV exports. Dampening consumer confidence indicates consumers are less optimistic about the economic future. With continued uncertainty in international trade and rising expectations of an upcoming recession, consumers will spend more cautiously and tend to first cut expenses on big-ticket discretionary items like RVs. The adverse shocks to the manufacturing sector could be mitigated by other growing sectors, such as construction, educational and health services, leisure and hospitality, and other services. Hence, GDP growth is likely to change little or be stagnant in 2020. The labor market will also adjust to the softening RV sector, which might scale back its production. Consequently, the unemployment rate will be higher in 2020, trending up to 3.5-4.0 percent.
South Bend-Mishawaka’s economy is more diversified than Elkhart-Goshen’s and is dominated by service production. Although the manufacturing sector is likely to further contract next year, the service sector will continue to grow in 2020. As the labor market is still tight, we will see wages continue to increase in 2020, which supports household consumption. Hence, South Bend-Mishawaka is expected to see modest growth in 2020. However, new home construction will be further weakened next year. Existing-home sales could be boosted to a certain extent by the cuts in the federal funds rate, but a slowdown of the housing market is looming due to higher housing prices and declining consumer confidence. In 2019, the three major sources of job growth in South Bend-Mishawaka came from construction, government and manufacturing. With the headwinds in the manufacturing and real estate sectors, the unemployment rate will potentially rise to 4.0-4.3 percent in 2020.
Notes
- The data on gross domestic production (GDP) by MSAs in 2018 are not available until December 2019. The summary on aggregate production in South Bend-Mishawaka and Elkhart-Goshen is estimated by the author based on electricity usage because the region’s economy and its energy use—especially electricity use—are positively related (Narayan, Narayan,& Popp, 2010). According to the American Electric Power statistics, monthly industrial electricity consumption in January-August 2019 averaged 32,711 (1000 kilowatt hour) in South Bend-Mishawaka and 18,695 (1000 kilowatt hour) in Elkhart-Goshen, down 0.5 percent and 8.6 percent from 2018, respectively. However, the relationship between electricity consumption and GDP is not perfect. With technology improvement in recent years, the demand for electricity may not increase as fast as the aggregate production (EIA, 2013). The above prediction on aggregate output is made in conjunction with labor market information.
- Labor force and employment data can be accessed on STATS Indiana at www.stats.indiana.edu/laus/laus_view3.html.
- The average unemployment rate refers to the average year-to-date rate of unemployment in January-August from 2011 to 2019. There are seasonal fluctuations in the monthly unemployment rate data.
- Source: Indiana Housing Market Update, August 2019.
- Historical RV data from the RV Industry Association: www.rvia.org/historical-rv-data.
- RV shipment data for August 2019: www.rvia.org/system/files/media/file/RV%20Report%20Aug-19_Sum.pdf.
References
- Burris, A. (2019, August 18). Recession fears are rising. Here's the status of economic bellwether Elkhart, Indiana. Indianapolis Star. Retrieved from www.indystar.com/story/money/2019/08/18/recession-elkhart-indiana-rv-recreational-vehicle-shipments-economy/2021354001/
- Narayan, P., Narayan, S., & Popp, S. (2010). Does electricity consumption panel Granger cause GDP? A new global evidence. Applied Energy. 87: 3294-3298.
- U.S. Energy Information Administration. (2013, March 22). U.S. economy and electricity demand growth are linked, but relationship is changing. Today in Energy. Retrieved from www.eia.gov/todayinenergy/detail.php?id=10491#


