Richmond forecast 2018

Director of the Business and Economic Research Center and Assistant Professor of Economics and Finance, Indiana University East
There are many indications that economic activity picked up steam in the Richmond region1 throughout 2017. Total personal income and per capita personal income have been climbing since 2009. Although the labor force in our region dropped slightly, unemployment has reached a historic low. Weekly wages have finally experienced significant growth, and the housing market has also improved. The IU East Business Confidence Index also increased, indicating that businesses are optimistic for 2018 in our region.
Income
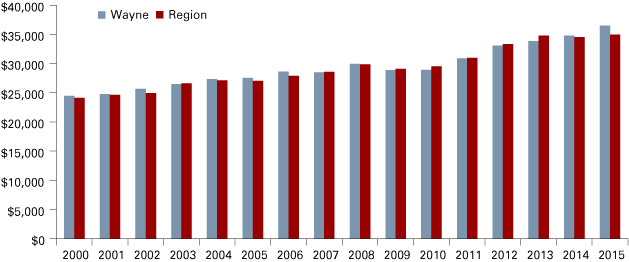
The total dollar volume of economic activity in the region and the local standard of living can be measured by total personal income and per capita personal income. Since 2009, these two indicators have been on a six-year growth spree for Wayne County and the Richmond region (see Figures 1 and 2).
Figure 1: Regional and Wayne County’s total personal income
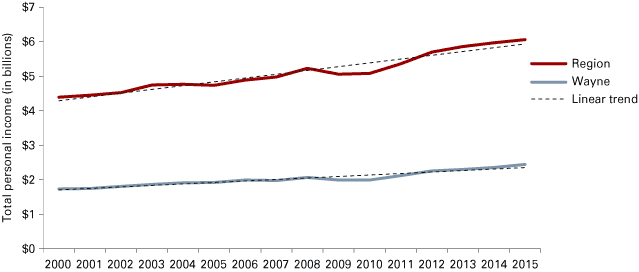
Note: Wayne County has approximately 40 percent of the region’s income and 39 percent of its population based on the 2015 data.
Source: U.S. Bureau of Economic Analysis (BEA) Regional Fact Sheets
Figure 2: Regional and Wayne County’s per capita personal income
Source: U.S. Bureau of Economic Analysis (BEA) Regional Fact Sheets
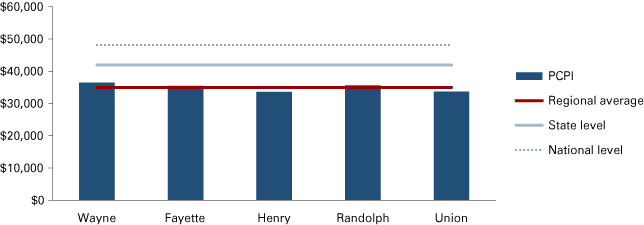
According to the most recent data from the U.S. Bureau of Economic Analysis, total personal income for Wayne County was $2.4 billion in 2015, having grown 2.1 percent from 2014, and ranked 27th in the state. Wayne County had a per capita personal income (PCPI) of $36,494, having grown 2.7 percent from 2014, and ranked 56th in the state. Although the region’s economy grew at a steady rate, per capita personal incomes were still below the state and national averages (see Figure 3).
Figure 3: County-level per capita personal income, 2015
Source: U.S. Bureau of Economic Analysis (BEA) Regional Fact Sheets
Labor market
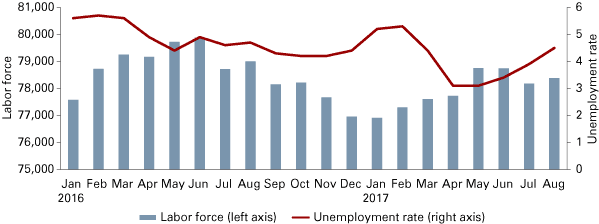
The labor market showed mixed signals in our region. The average size of the labor force slid 2 percent in Wayne County for the first eight months of 2017 and fell 0.8 percent for the region as a whole. Wayne County’s labor force included 30,178 people in August 2017, and the region’s labor force was 78,378. Although the labor force shrank, unemployment rates reached historically low levels in April 2017: 3 percent in Wayne County and 3.1 percent for the region (see Figures 4 and 5).
Figure 4: Wayne County’s labor force and unemployment rate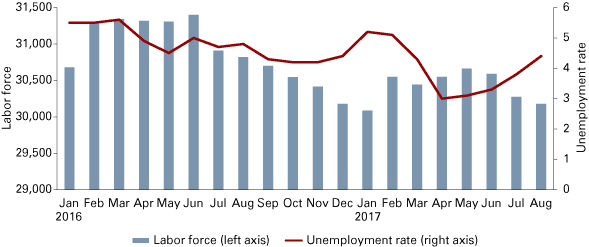
Note: Data are not seasonally adjusted.
Source: Local Area Unemployment Statistics (LAUS) data from the U.S. Bureau of Labor Statistics
Figure 5: Regional labor force and unemployment rate
Note: Data are not seasonally adjusted.
Source: Local Area Unemployment Statistics (LAUS) data from the U.S. Bureau of Labor Statistics
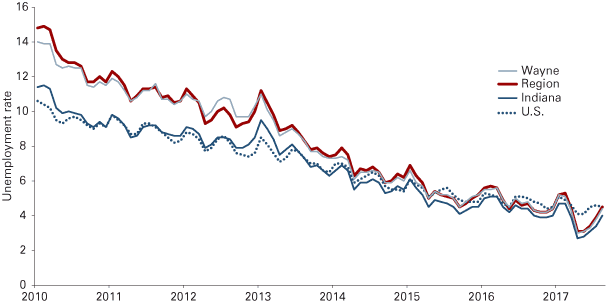
Unemployment in our region is following state and national trends (see Figure 6). While the low unemployment rate is clearly cause for optimism, the falling labor force is a cause for concern because it indicates that people are either dropping out of the labor market or relocating to a different area.
Figure 6: Unemployment rate comparison, January 2010 to August 2017
Note: Data are not seasonally adjusted.
Source: Local Area Unemployment Statistics (LAUS) data from the U.S. Bureau of Labor Statistics
Jobs and wages
Table 1 shows changes in employment by industry. As of the first quarter of 2017, 29,807 people were employed in nonfarm sectors in Wayne County and 57,062 in the region. There were 115 job gains in Wayne County but 490 job losses for the region. Manufacturing showed particularly strong growth, outshining other industries. Wayne County added 116 more manufacturing jobs and the region added 268. Other notable job gains appeared in wholesale trade; finance and insurance; and entertainment and recreation. Sectors experiencing major job losses were transportation and warehousing; professional and business services (only for the region); education services, accommodation and food services; other services; and government. The reason the region lost so many jobs in the professional and business services sector might be due to the closure of Marujun in Randolph County in 2016, which had a significant impact.
Table 1: Employment by industry
| Wayne County | Region | |||
|---|---|---|---|---|
| 2017 Q1 | One-year change | 2017 Q1 | One-year change | |
| Total Nonfarm | 29,807 | 115 | 57,062 | -490 |
| Total Private | 25,502 | 194 | 46,944 | -383 |
| Manufacturing | 5,672 | 116 | 11,540 | 268 |
| Wholesale trade | 868 | 2 | 1,840 | 79 |
| Retail trade | 3,831 | 7 | 6,928 | -40 |
| Transportation and warehousing | 651 | -46 | 1,123 | -73 |
| Information | 212 | 0 | 435 | -13 |
| Finance and insurance | 916 | 27 | 1,539 | 30 |
| Real estate and rental and leasing | 147 | -7 | 351 | 5 |
| Professional and business services | 2,529 | 53 | 3,821 | -544 |
| Education services | 598 | -16 | 630 | -19 |
| Health care and social assistance | 5,396 | 53 | 9,136 | -81 |
| Entertainment and recreation | 136 | 25 | 322 | 39 |
| Accommodation and food services | 2,975 | -54 | 5,207 | -71 |
| Other services | 644 | -18 | 1,354 | -3 |
| Government | 4,305 | -79 | 10,118 | -108 |
Note: Some data for Union county were not disclosed.
Source: Quarterly Census of Employment and Wages (QCEW) data from the U.S. Bureau of Labor Statistics
The increase in weekly wages is compelling. After a long period of anemic wage growth, weekly wages finally saw a sizeable increase in our region. In the first quarter of 2017, average weekly wages for total nonfarm employment grew by 8.9 percent to $735 in Wayne County over the previous year, and by 7.4 percent to $699 in the region, compared to 7.6 percent average growth for the state (see Table 2). Several industries had double-digit wage increases in Wayne County (e.g., transportation and warehousing; information; finance and insurance; real estate and rental and leasing; health care and social assistance; and other services. Only two sectors (education services and entertainment and recreation) experienced a slight fall in wages in Wayne County and the region. The better-than-expected wage growth reflects an upswing in business activity and profitability and a relatively tight labor market in the region.
Table 2: Average weekly wages
| Wayne | Region | State | ||||
|---|---|---|---|---|---|---|
| 2017 Q1 | One-year change | 2017 Q1 | One-year change | 2017 Q1 | One-year change | |
| Total nonfarm | $735 | 8.9% | $699 | 7.4% | $918 | 7.6% |
| Total private | $739 | 9.3% | $701 | 8.2% | $925 | 7.9% |
| Manufacturing | $925 | 6.4% | $920 | 5.5% | $1,277 | 7.0% |
| Wholesale trade | $931 | 7.9% | $820 | 4.1% | $1,323 | 8.3% |
| Retail trade | $457 | 5.1% | $461 | 6.5% | $521 | 7.4% |
| Transportation and warehousing | $980 | 12.0% | $925 | 9.5% | $853 | 7.3% |
| Information | $786 | 12.8% | $678 | 8.5% | $1,178 | 9.2% |
| Finance and insurance | $1,035 | 12.6% | $1,001 | 12.9% | $1,540 | 9.2% |
| Real estate and rental and leasing | $752 | 31.2% | $574 | 20.3% | $894 | 6.0% |
| Professional and business services | $728 | 5.1% | $661 | 8.7% | $1,028 | 9.0% |
| Education services | $656 | -1.8% | $630 | -1.6% | $712 | 5.3% |
| Health care and social assistance | $919 | 14.9% | $780 | 13.7% | $884 | 8.5% |
| Entertainment and recreation | $333 | -4.3% | $328 | -3.0% | $730 | 15.9% |
| Accommodation and food services | $271 | 0.0% | $263 | 1.9% | $300 | 6.8% |
| Other services | $478 | 10.4% | $462 | 5.2% | $607 | 7.8% |
| Government | $824 | 4.2% | $786 | 3.1% | $1,036 | 4.2% |
Note: Some data for Rush and Union counties were not disclosed.
Source: Quarterly Census of Employment and Wages (QCEW) data from the U.S. Bureau of Labor Statistics
Housing market
The number of single-family building permits issued in Wayne County fell by four units in the first 10 months of 2017, compared to the same period of the prior year (see Table 3). However, the proposed cost of new residential construction increased by 15 percent in 2017, which indicates high-valued homes face strong and increasing demand.
Table 3: New single-family building permits in Wayne County
| Building permits | Proposed cost | |||
|---|---|---|---|---|
| 2016 | 2017 | 2016 | 2017 | |
| January | 0 | 0 | 0 | 0 |
| February | 2 | 1 | $ 305,000 | $ 240,000 |
| March | 1 | 2 | $ 431,000 | $ 572,000 |
| April | 3 | 2 | $ 630,000 | $ 440,000 |
| May | 2 | 2 | $660,000 | $483,000 |
| June | 2 | 2 | $430,000 | $1,025,000 |
| July | 4 | 0 | $573,000 | 0 |
| August | 3 | 3 | $375,000 | $495,000 |
| September | 1 | 1 | $100,000 | $195,000 |
| October | 1 | 2 | $375,000 | $1,020,000 |
| Total | 19 | 15 | $ 3,879,000 | $ 4,470,000 |
Source: Wayne County Building Commission
The housing market experienced other positive signs in terms of closed sales and median sales price (see Table 4). In Wayne County, 560 houses sold between January and August 2017, an increase of about 11 percent from the same period in 2016. The region’s sales followed the same trend. The median sales price in Wayne County was about the same as in 2016, but the region’s median price climbed 6 percent. According to Tracie Upchurch, the sales manager of Better Homes and Gardens/First Realty Group, low housing inventory and low interest rates were two main drivers to propel the housing market in 2017.
Table 4: Year-to-date housing market update
| Closed sales | Median price | |||||
|---|---|---|---|---|---|---|
| 2016 | 2017 | Change | 2016 | 2017 | Change | |
| Statewide | 58,332 | 60,184 | 3.2% | $139,200 | $146,500 | 5.2% |
| Region | 968 | 1,060 | 9.5% | $80,000 | $85,000 | 6.3% |
| Wayne | 505 | 560 | 10.9% | $89,900 | $89,950 | 0.1% |
| Henry | 249 | 295 | 18.5% | $73,000 | $86,500 | 18.5% |
| Randolph | 125 | 121 | -3.2% | $63,450 | $73,450 | 15.8% |
| Fayette | 84 | 82 | -2.4% | $75,200 | $65,900 | -12.4% |
| Union | 5 | 2 | -60.0% | $60,000 | $80,050 | 33.4% |
Note: Year-to-date data reflect January through August data.
Source: Indiana Real Estate Market Report by the Indiana Association of Realtors, except Wayne County’s data and the region’s median price data, which were provided by Better Homes and Gardens/First Realty Group
Outlook
In September 2017, the IU East Business and Economic Research Center conducted the second annual business outlook survey in the east-central Indiana region, including Fayette, Henry, Randolph, Union and Wayne counties. In this survey, business owners/managers were asked to provide an opinion of various aspects of business performance and the financial environment for this year, as well as their expectations for next year. Survey results allowed us to compute a base year business confidence index for 2016, and now that survey responses are available for the following year, we can draw some conclusions about how the region’s business outlook has changed.
Based on the survey responses, the 2017 IU East Regional Business Confidence Index is 103.98, an increase of approximately 4 percent from 2016 (the base year). This increase shows the overall business community has an optimistic forecast for next year, and an increasingly optimistic appraisal of the region’s current and future economic performance.
As illustrated in Table 5, 55 percent of participants reported their production/business activity increased this year; 27 percent hired more employees, and about two-thirds of businesses continued to employ the same number of workers as last year; more than half (54 percent) increased investment spending this year, and 43 percent maintained investment spending at about the same level as last year. In terms of enterprise profitability, 42 percent of participants indicated an increase, 41 percent reported about the same profit levels, and only 17 percent realized lower profits. However, 62 percent experienced higher costs of doing business this year.
Table 5: Compared to the same period last year, how has each of the following changed for your business/company?
| Answer options | Has increased significantly (>5%) | Has increased slightly (<5%) | Has remained about the same | Has decreased slightly (<5%) | Has decreased significantly (>5%) | Response count |
|---|---|---|---|---|---|---|
| Production/business activity | 28.0% | 27.0% | 34.0% | 8.0% | 3.0% | 100 |
| Number of employees | 8.0% | 19.0% | 63.0% | 10.0% | 0.0% | 100 |
| Capital investment | 20.0% | 34.0% | 43.0% | 2.0% | 1.0% | 100 |
| Cost of doing business | 11.0% | 51.0% | 36.0% | 2.0% | 0.0% | 100 |
| Profitability | 11.2% | 30.6% | 40.8% | 13.3% | 4.1% | 98 |
Source: The 2017 East-Central Indiana Business Survey, conducted by IU East Business and Economic Research Center, September 2017
When asked about their expectations for next year’s business operations (see Table 6), a clear majority (63 percent) of business owners or managers expect to see growth in production/business activity. Most (64 percent) expressed a preference for avoiding changing their firm’s employment level, but still 33 percent of businesses report they expect to create new positions. Year-over-year increases in capital investment are planned by 41 percent of responding enterprises, and about half (49 percent) expect to hold investment spending steady at approximately last year’s level. Positively, half (50 percent) of businesses anticipate higher profits over the coming year, with another 40 percent expecting profits to hold steady, and only 10 percent of business owners/managers foreseeing decreased profits. Again, more than half of participants (56 percent) expressed concern about the cost of doing business increasing in the region next year. This is the only potentially unfavorable expectation we uncovered.
Table 6: How do you anticipate each of the following will change next year for your business/company as compared with this year?
| Answer options | Will increase significantly (>5%) | Will increase slightly (<5%) | Will remain about the same | Will decrease slightly (<5%) | Will decrease significantly (>5%) | Response count |
|---|---|---|---|---|---|---|
| Production/business activity | 20.4% | 42.7% | 31.1% | 5.8% | 0.0% | 103 |
| Number of employees | 3.9% | 29.4% | 63.7% | 2.9% | 0.0% | 102 |
| Capital investment | 7.8% | 33.3% | 49.0% | 9.8% | 0.0% | 102 |
| Cost of doing business | 4.0% | 52.5% | 40.6% | 3.0% | 0.0% | 101 |
| Profitability | 11.9% | 37.6% | 40.6% | 8.9% | 1.0% | 101 |
Source: The 2017 East-Central Indiana Business Survey, conducted by IU East Business and Economic Research Center, September 2017
Finally, when asked their opinion of 2018’s business and economic conditions in the region (see Table 7), a majority of participants (63.1 percent) expressed optimism, and 26.2 percent felt conditions would remain about the same. Only about 10.7 percent of them projected moderate declining business conditions for next year.
Table 7: How do you project the overall business and economic conditions in 2018 in your area?
| Answer options | Response percent | Response count |
|---|---|---|
| Strongly optimistic | 5.8% | 6 |
| Moderately optimistic | 57.3% | 59 |
| About the same | 26.2% | 27 |
| Moderately pessimistic | 10.7% | 11 |
| Strongly pessimistic | 0.0% | 0 |
| Total | 103 | |
Source: The 2017 East-Central Indiana Business Survey, conducted by IU East Business and Economic Research Center, September 2017
Globally, continued economic recovery and expansion are expected. According to the Wall Street Journal, the International Monetary Fund (IMF) raised its forecast of the global growth rate to 3.6 percent for 2017 and 3.7 percent for 2018—higher than the 3.2 percent growth they forecast previously in 2016. The article claims that “the IMF agreed that in the short term, the global economy has achieved a degree of momentum that has eluded the world for many years. This year will likely be the strongest since 2014, with most major economies strengthening. Enough may strengthen again in 2018 that it could be the strongest year for growth since 2011, according to IMF projections.”2
The broad improvement in the U.S. economy is also acknowledged by the Federal Reserve in their September 18-19 Federal Open Market Committee meeting, in which the Fed decided to exit crisis-era stimulus.3
Summary
Amid the increasingly robust expectations for world and U.S. economic performance, our region’s economic and business activity in general will also continue to strengthen at an optimistic pace next year, based on the business outlook survey results. The unemployment rate is expected to maintain at low levels around 4 percent. Both job and wage increases are likely to be moderate in general, but some sectors could experience stronger growth than others, particularly manufacturing. The likely uptick on employment and wages should benefit the local housing market, hopefully offsetting the impact of potential hikes in the Fed’s benchmark interest rates, which in turn would influence mortgage lending.
Acknowledgements
The author deeply appreciates several people who contribute input for this article: Dr. Oi Lin Cheung calculated the 2017 IU East Regional Business Confidence Index; Tracie Upchurch provided housing data for Wayne County; Debbie Bailey provided the data on building permits for Wayne County; and Dr. Robert Mulligan provided valuable comments to the early draft.
Notes
- The Richmond region includes five east-central Indiana counties: Fayette, Henry, Randolph, Union and Wayne.
- Josh Zumbrun, “Global Economic Expansion Exceeds Forecasts, IMF Says,” Wall Street Journal, October 11, 2017, A8.
- Nick Timiraos, “Fed to Unwind Crisis-Era Stimulus,” Wall Street Journal, September 21, 2017, A1.


