South Bend and Elkhart forecast 2018

Director of the Bureau of Business and Economic Research and Associate Professor of Economics, Judd Leighton School of Business and Economics, Indiana University South Bend
The South Bend-Mishawaka Metropolitan Statistical Area (MSA) and Elkhart-Goshen MSA in 2017 experienced stronger economic growth, lower unemployment rates, moderate growth in wages and a more prosperous housing market. Yet, the labor market imbalance is evident with a smaller labor force and lower employment levels in South Bend-Mishawaka, but an expanded labor force and higher employment levels in Elkhart-Goshen.
Real metropolitan GDP
The combined economy of the South Bend-Mishawaka and Elkhart-Goshen MSAs grew strongly in 2016.1 The total real metropolitan gross domestic product (RGDP) in 2016 surpassed 2015 by nearly $1.2 million, a rise of 4.6 percent.2 Specifically, the economic performance in the Elkhart-Goshen MSA was more pronounced than the South-Bend-Mishawaka MSA by adding $838 million to its real GDP, about 6.5 percent in output growth. The South Bend-Mishawaka MSA grew moderately at 2.7 percent in its aggregate production, gaining $318 million. However, the aggregate production in the South Bend-Mishawaka MSA was still $205 million below its peak level before the 2007 recession, despite the continuous growth of the past three years.
Labor force and employment
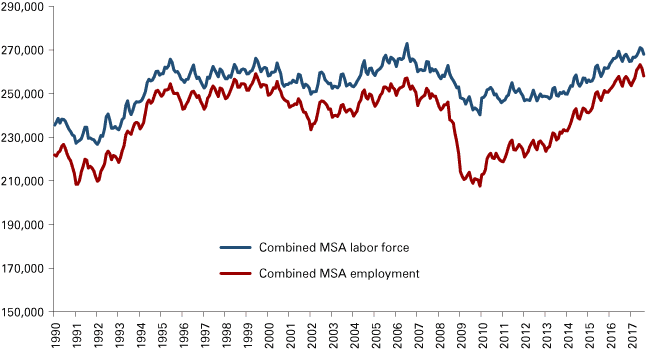
The joint labor force in the two metropolitan areas expanded modestly over the year, adding 3,348 workers to the local labor force (see Figure 1).3 In August 2017, the total labor force in the combined region was 268,111 workers, exceeding the June 2007 pre-recession level of 264,700 workers. A larger local labor force signals an improved local labor market and economic expansion when more residents actively look for jobs. In particular, the labor force in Elkhart-Goshen increased by 4,441 workers, whereas South Bend-Mishawaka lost 1,093 workers in its labor force.
Figure 1: Labor force and employment in the Elkhart-Goshen and South Bend-Mishawaka MSAs combined, January 1990 to August 2017

Note: Data are not seasonally adjusted.
Source: STATS Indiana, using Local Area Unemployment Statistics (LAUS) from the U.S. Bureau of Labor Statistics
The number of people employed in the combined region grew from 253,436 in August 2016 to 258,146 in August 2017. The Elkhart-Goshen MSA added 5,057 workers, while employment in the South Bend-Mishawaka MSA declined slightly by 347. The 4.8 percent increase in Elkhart-Goshen's employment was far above the national average growth rate of employment of 1.2 percent and the state average rate of 1.0 percent; however, the 0.2 percent job loss in the South Bend-Mishawaka MSA was below the national and state averages in 2017.
Unemployment
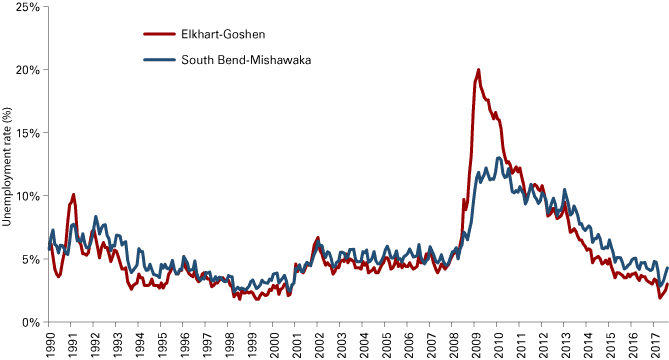
Under the dynamics of labor force and employment change, the unemployment rates in both MSAs declined over the year. The South Bend-Mishawaka MSA’s unemployment rate settled at 4.3 percent in August 2017, down half a percentage point from August 2016.4 Meanwhile, the jobless rate in Elkhart-Goshen decreased by 0.6 percentage points from 3.6 percent in August 2016 to 3 percent in August 2017.
Figure 2 illustrates the unemployment rates in the Elkhart-Goshen and South Bend-Mishawaka MSAs since 1990. For both areas, the current unemployment rates are the lowest in 15 years. In comparison, the unemployment rate in Elkhart-Goshen was much lower than the U.S. figure of 4.5 percent and the Indiana rate of 4 percent in August 2017. Meanwhile, the unemployment rate in the South Bend-Mishawaka area was between the state and national average unemployment rates.
Figure 2: Unemployment rate in the Elkhart-Goshen and South Bend-Mishawaka MSAs, January 1990 to August 2017

Note: Data are not seasonally adjusted.
Source: STATS Indiana, using Local Area Unemployment Statistics (LAUS) from the U.S. Bureau of Labor Statistics
Employment by industry
Table 1 displays employment data by industry and by metro area in August 2017 and the year-over-year changes from August 2016. In August 2017, the nonfarm sectors in both areas employed 276,800 workers and added 7,200 new jobs over the 12-month period. The statistics indicate an accelerated pace in job creation for the combined economy in 2017 relative to 2016.
Table 1: Employment by industry and metro area, August 2017
| Elkhart-Goshen | South Bend-Mishawaka | Combined MSAs | ||||
|---|---|---|---|---|---|---|
| Industry | Employment | Change since August 2016 | Employment | Change since August 2016 | Employment | Change since August 2016 |
| Total nonfarm | 139,900 | 7,400 | 136,900 | -200 | 276,800 | 7,200 |
| Natural resources, mining and construction | 3,300 | 0 | 6,100 | 100 | 9,400 | 100 |
| Manufacturing | 68,200 | 4,900 | 16,700 | -1,000 | 84,900 | 3,900 |
| Trade, transportation and utilities | 20,300 | 1,000 | 25,400 | -100 | 45,700 | 900 |
| Information | 400 | 0 | 1,500 | -100 | 1,900 | -100 |
| Financial activities | 2,800 | 0 | 5,500 | 0 | 8,300 | 0 |
| Professional and business services | 11,500 | 700 | 14,400 | 100 | 25,900 | 800 |
| Private educational and health services | 12,600 | 400 | 33,900 | 600 | 46,500 | 1,000 |
| Leisure and hospitality | 8,100 | 200 | 14,700 | 400 | 22,800 | 600 |
| Other services | 4,100 | 100 | 6,100 | 0 | 10,200 | 100 |
| Government (includes public schools and hospitals) | 8,600 | 100 | 12,600 | -200 | 21,200 | -100 |
Source: STATS Indiana, using Current Employment Statistics (CES) from the U.S. Bureau of Labor Statistics
The following industries in the combined MSAs saw job growth in 2016-2017: natural resources, mining and construction; manufacturing; trade, transportation and utilities; professional and business services; private educational and health services; leisure and hospitality; and other services. Financial activities had no job changes over the year. The information and government sectors each cut 100 jobs between 2016 and 2017.
However, the job growth in the two MSAs is imbalanced. First, the Elkhart-Goshen MSA added 7,400 new total nonfarm jobs in sectors between August 2016 and August 2017, whereas 200 nonfarm jobs were lost in the South Bend-Mishawaka MSA. Second, the major driving forces of job increase in Elkhart-Goshen were manufacturing (+4,900 jobs) and trade, transportation and utilities (+1,000 jobs). However, both sectors cut jobs in South Bend-Mishawaka, losing 1,000 jobs in manufacturing and 100 jobs in trade, transportation and utilities.
Meanwhile, Elkhart-Goshen experienced job growth in more sectors from August 2016 to August 2017, which included professional and business services (+700 jobs); private educational and health services (+400 jobs); leisure and hospitality (+200 jobs); other services (+100 jobs); and government (+100 jobs).
The South Bend-Mishawaka MSA also saw job losses in information (-100 jobs) and government (-200 jobs). Four sectors added new jobs that included natural resources, mining and construction (+100 jobs); professional and business services (+100 jobs); private educational and health services (+600 jobs); and leisure and hospitality (+400 jobs).
Local wages and hours worked
Local workers have earned more over the past 12 months suggested by higher average weekly wages of private sectors in both areas. The average weekly wage in the Elkhart-Goshen MSA rose 9.9 percent from August 2016 and reached $872 in August 2017; meanwhile, the South Bend-Mishawaka MSA’s average weekly wage was $837 in August 2017, up 6.6 percent from August 2016. Over the same period, average weekly hours increased 3.8 percent to 38.3 hours in the Elkhart-Goshen MSA and 2.3 percent to 35.3 hours in the South Bend-Mishawaka MSA.
Housing
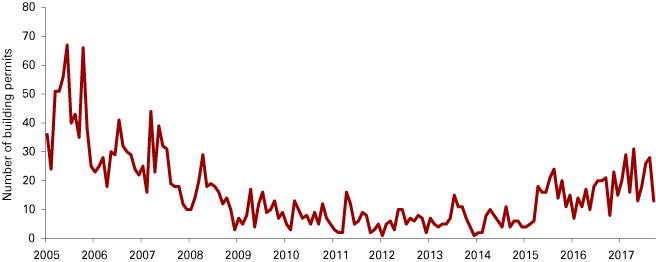
New residential construction, indicated by the number of single-family building permits issued in St. Joseph County showed a stronger growth in 2017 (current data for Cass and Elkhart counties are not available). As of August 2017, 181 single-family units were authorized by building permits in the first eight months, 54.7 percent above the same period figure in 2016 (see Figure 3). Although this figure is comparable to that of 2015, it has not recovered to pre-recession levels (for example, 368 permits were issued in the first eight months of 2005).
Figure 3: Single-family residential building permits in St. Joseph County, January 2005 to August 2017

Source: St. Joseph County Building Department
Recent housing market data released by the Indiana Association of Realtors also confirms the upspring in the local housing market.5 The year-over-year inventory of homes for sale fell 6.8 percent while closed sales increased 25.2 percent in August 2017 relative to August 2016. With a tightening supply of existing homes for sale and an increasing demand for homes, the median sales price in St. Joseph County went up 3.5 percent in August 2017 compared to the prior year.
Summary
The economy in both areas is forecasted to grow in 2018. The local economy in general is affected by national trends. As the International Monetary Fund (IMF) predicts moderate growth of 2.3 percent in the U.S. economy in 2018, greater expenditures by consumers and business will propel the local economy to a higher level.6 The local economy as measured in real metropolitan GDP is projected to have experienced strong growth in 2017, but will grow more moderately in 2018 given fiscal policy uncertainty and rising interest rates.
The labor force in South Bend-Mishawaka is expected to expand in 2018 accompanied by job growth. The unemployment rate projection for this area is about 4 percent for 2018.7 Given the industrial structure in South Bend-Mishawaka, the driving force for jobs will be private educational and health services, as well as leisure and hospitality.
However, the labor force has been tight in Elkhart-Goshen and that might constrain further growth in this area. In fact, in July 2017, the labor force reached the highest level since 1990 at 114,149. Similarly, the number of employed was also at a historic high of 111,274 in July 2017. The even lower unemployment rate in 2017 indicates full-employment status for Elkhart-Goshen. The 2018 unemployment rate projection is similar to the 2017 rates with seasonal fluctuations, at around 2.5-3 percent.8
In 2018, income is predicted to grow moderately in both MSAs given the tight labor market. As earnings are expected to rise and the economic outlook is optimistic for 2018, the demand for housing will continue to grow. New home construction may increase, but not as fast as the demand grows, so housing prices will likely rise further in St. Joseph County. Even if the interest rate is predicted to be higher, it will remain at a relatively low level in the year ahead, which would help keep borrowing costs low and, thus, further the recovery in the housing market.
Notes
- The data on metropolitan gross domestic product are from the U.S. Bureau of Economic Analysis. The latest data available are for 2016.
- In 2016, real metropolitan GDP in Elkhart-Goshen and South Bend-Mishawaka was $26.125 billion.
- Access these labor force and employment data on STATS Indiana at www.stats.indiana.edu/laus/laus_view3.html.
- The unemployment rate of the South Bend-Mishawaka MSA in August 2017 was 4.7 percent.
- Source: Indiana Housing Market Update, August 2017.
- The prediction is from the World Economic Outlook, October 2017, provided by the International Monetary Fund.
- The average unemployment rate in South Bend-Mishawaka was 3.9 percent for the January-August 2017 period. The lower unemployment rate that occurred in second quarter 2017 was due to lower labor force. With an expanded labor force, this low unemployment rate is not sustainable.
- The average unemployment rate in Elkhart-Goshen in the January-August 2017 period was around 2.7 percent.


