Kokomo forecast 2018

Dean, School of Business, Indiana University Kokomo
The purpose of this article is not to provide a comprehensive analysis of economic conditions. It is rather a concise summary of key data that will both allow us to see how the regional economy has progressed during 2017, as well as envision where we may be heading in 2018.
The north-central Indiana regional economy is comprised of the 14-county service area for Indiana University Kokomo.1 This region is economically diverse. Some cities and/or counties are very dependent on the health of large manufacturers. At the same time, others are heavily rural, and agricultural productivity is critical to their well-being. Given this diversity, we will attempt to address key issues that affect the region as a whole, but greater emphasis will be placed on Kokomo and Howard County.
The employment picture
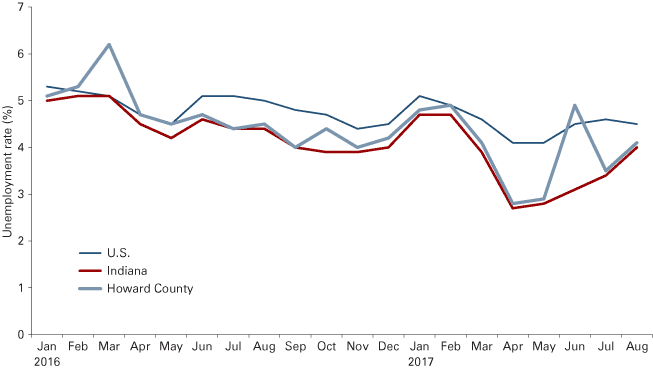
The unemployment rate has fallen slightly over the year. In September 2016, the unemployment rates for the U.S., Indiana, and Howard County were 4.8, 4.0 and 4.0, respectively. Unemployment rates had fallen during 2016 from nearly 6 percent, and at that time we reported that there would be very little additional downward movement in 2017.
The prediction appears to have been accurate if one looks at August 2017 in Figure 1. However, the unemployment rates dropped precipitously from January to May 2017, falling to below 3 percent for both Howard County and the state in April and May. Meanwhile, the U.S. rate declined but still remained above 4 percent. Since May, however, the rate jumped upward, returning to a more sustainable rate, with both Indiana and Howard County hovering around 4 percent.
Figure 1: Unemployment rates, January 2016 to August 2017

Source: STATS Indiana, using Local Area Unemployment Statistics (LAUS) from the U.S. Bureau of Labor Statistics
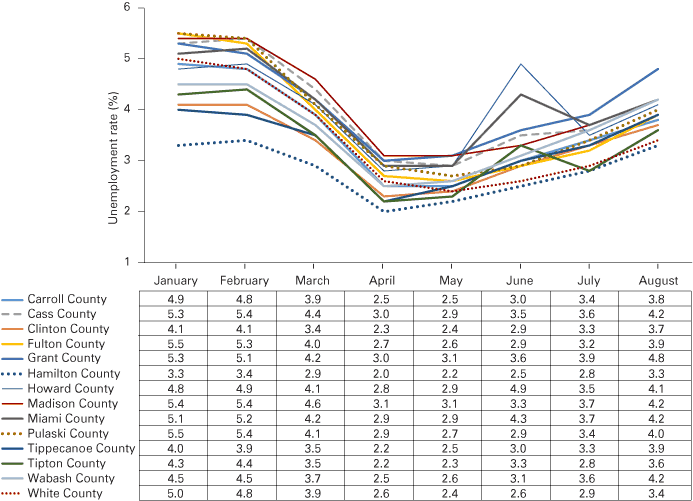
Looking beyond Howard County and expanding into the 14-county region, fluctuations in the unemployment rates display a similar pattern since the beginning of the year (see Figure 2). During the first four to five months of 2017, each of the counties saw their unemployment rates decrease considerably. Hamilton County experienced the smallest decrease with the rate falling 1.3 points from 3.3 to 2.0. However, several counties, notably Fulton and Pulaski, saw their unemployment rates fall by nearly 3 percentage points in just several months. For the remainder of the region, the unemployment rates experienced declines between 2 and 2.5 points.
Figure 2: Regional unemployment rates

Source: STATS Indiana, using Local Area Unemployment Statistics (LAUS) from the U.S. Bureau of Labor Statistics
After bottoming out in April/May, the unemployment rates for each of the counties in the region began a noticeable upward trend. Hamilton County saw its unemployment progress erased with a return to the 3.3 percent rate experienced at the beginning of the year. Tippecanoe County similarly saw nearly all of its progress eliminated. However, for many of the remaining counties, their unemployment rate in August 2017 remained well below that at the beginning of the year, often by more than 1 percentage point.
What is interesting in the data for three of the counties—Howard, Miami and Tipton—is the marked “blip” experienced from May to June to July. To some extent this may be explained by the seasonal nature of the workforce. The timing of the change would coincide quite well with the ending of the school year and the efforts by many students attempting to seek employment for the summer.
Industry analysis
Nonfarm employment within the Kokomo MSA, rose by 1,500 (or 3.6 percent) from August 2016 through August 2017. This would correspond with the decline in the level of unemployment in Howard County and the immediately surrounding counties. The majority of the job growth was in private sector employment. The largest nominal increase in jobs was the manufacturing sector, with an increase of 700 jobs (5.6 percent). In the goods-producing sector, the mining, logging and construction category experienced the greatest percentage change at 9.1 percent, or 100 jobs. While the services sector did experience an overall increase in jobs, the three areas of retail trade, leisure and hospitality, and trade, transportation and utilities each experienced losses of roughly 100 jobs each.
Agricultural growth
Heavy and persistent rains in spring 2017 resulted in widespread flooding and generated a great deal of uncertainty about crop production in Indiana, especially in north-central Indiana. For many farmers, the first corn planting was flooded out, and in some instances the second planting was substantially delayed due to excess field moisture. Where the planting delay was considerable, growers switched to soybeans to take advantage of a shorter growing season. Corn acreage planted and harvested were both down by approximately 4.5 percent in 2017 in comparison to 2016. However, to the pleasant surprise of many growers, the yield per acre for corn was 173 bushels per acre, the same as the previous year. Nonetheless, corn production for the state was down 4.5 percent (see Table 1).
Table 1: Indiana crop planted, harvested, yield and production
| 2015 | 2016 | 2017* | |
|---|---|---|---|
| Corn | |||
| Planted (1,000 acres) | 5,650 | 5,600 | 5,350 |
| Harvested (1,000 acres) | 5,480 | 5,470 | 5,220 |
| Yield per acre (bushels) | 150.0 | 173.0 | 173.0 |
| Production (1,000 bushels) | 822,200 | 946,310 | 903,060 |
| Soybeans | |||
| Planted (1,000 acres) | 5,550 | 5,650 | 5,950 |
| Harvested (1,000 acres) | 5,500 | 5,630 | 5,940 |
| Yield per acre (bushels) | 50.0 | 57.5 | 55.0 |
| Production (1,000 bushels) | 275,000 | 323,725 | 326,700 |
* The 2017 data represent the forecast from October.
Source: “Indiana Agriculture Report,” U.S. Department of Agriculture’s National Agricultural Statistics Service, October 2017
The delayed planting season and the switch to soybeans led to an increase in the acreage of soybeans both planted and harvested. In comparison to 2016, 2017 recorded an increase of 5.3 percent and 5.5 percent, respectively, for planting and harvesting. The 2017 yield was down by 4.3 percent and almost fully offset the increase in planting. Overall, the total level of soybean production increased just under 1 percent.
Crop prices for corn and soybeans fluctuated significantly over the last year. From August 2016 to August 2017, corn prices per bushel rose approximately 3 percent. However, the August 2017 prices are 6 percent lower than July 2017. With the considerable growth in acreage of soybeans planted and harvested, the price per bushel for soybeans has fallen nearly 8 percent. It is important to note that the agriculture data presented here are for the entire state. County data for 2017 won’t be available from the U. S. Department of Agriculture until after February 2018.
Forecast for 2018
The forecast for 2018 employment? It will continue as relatively stable (i.e., at or very near the levels seen throughout 2017). Again, economists refer to such low levels of unemployment as representing “full employment.” While the rate might dip below these levels in the short-term, as it did during spring 2017, those levels are not sustainable without generating concerns about inflation.
Nonetheless, employment opportunities continue to grow in Kokomo and Howard County. Construction projects in various stages of completion can be found throughout the region. While some projects still involve rebuilding following the August 2016 tornado, the vast majority are new projects in various locations. Numerous housing projects are underway that will provide a range of accommodations. From upscale town houses and condominiums, to assisted-living centers that will not only provide housing but also jobs, the area around downtown and near municipal stadium is quickly changing. Plans for a new hotel, restaurant and bar near the riverfront are also in the works, which will bring both temporary construction jobs and longer-term hospitality and tourism positions.
Such growth is rapidly altering the profile and climate of downtown Kokomo. As has been pointed out in previous years, the economic health of our region remains heavily tied to manufacturing, and especially to the automobile industry. To this extent, much of our future opportunities are also heavily dependent on the broader U.S. and even global economies.
In terms of agriculture, the major driver remains the weather patterns, which are highly unpredictable. In 2016, growing conditions were ideal and production was at record levels just a year after late spring rain and flooding wreaked havoc on our area. Again, 2017 proved to be a challenge. Through some rotation of crops, the end result was not as some originally feared. Production though is not the only factor. Demand for corn and soybeans in the U.S. and the rest of the world, especially in China, are critical in keeping crop prices at levels where growers can succeed and not just get by. Having several consecutive years much like 2016 would certainly be beneficial.
Overall, there is a general feeling of optimism with regard to the region. However, the Kokomo regional and the Indiana economies go as the national and world economies go. So far, that rising tide seems to be lifting a great many boats. Uncertainty with domestic political matters and global challenges with several other nations—most notably North Korea and Iran—leave open the possibility of the development of hostilities, or at least ratcheted up sanctions. Challenges in trade with Mexico may also be faced given unsettled matters of immigration.
References
- Hoosiers by the Numbers: www.hoosierdata.in.gov/docs/egr4/lmr/2017/lmrmth08.pdf
- Indiana Agricultural Report (October 2017): www.nass.usda.gov/Statistics_by_State/Indiana/Publications/Ag_Report/2017/iar1710.pdf
- STATS Indiana: www.stats.indiana.edu/laus/laus_view3.html


