Bloomington forecast 2018

Director, Indiana Business Research Center, Indiana University Kelley School of Business
Local economy expanding slowly
The overall economy (measured by gross domestic product, or GDP) of the Bloomington Metropolitan Statistical Area (MSA), which is comprised of Monroe and Owen counties, grew 4.5 percent from 2013 to total $6.02 billion in 2016.1 However, this was less than 2 percent above the local economy’s size a decade earlier in 2006 (pre-Great Recession), and well below its 2010 peak. On a per capita basis, the Bloomington metro economy in 2016 generated $36,192 per person, ranking 8th among Indiana’s 11 MSAs (ahead of Terre Haute, Michigan City-LaPorte and Muncie).
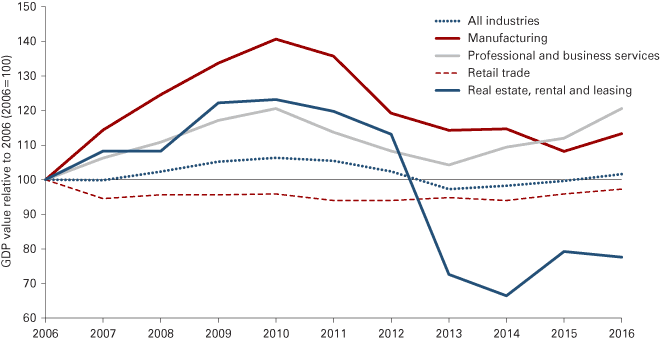
Figure 1 displays the change in Bloomington’s real GDP over 10 years for all industries combined, and also for four of its largest industries. Two of these industries have shrunk over this period: Retail trade declined by less than 3 percent, but the real estate, rental and leasing sector contracted by more than 22 percent. The latter sector rode the real estate bubble to boast 23 percent growth by its peak in 2010, but then retreated to less than 78 percent of its 2006 size. However, the local real estate, rental and leasing industry has regained some lost ground in the last two years of available data.
Figure 1: Relative change in Bloomington MSA real GDP by industry

Source: IBRC, using U.S. Bureau of Economic Analysis data
In comparison, the local manufacturing sector has experienced substantial ups and downs; by 2016, it was 13 percent larger than a decade earlier, but still well below its 2010 peak. The sector with the largest overall output growth during the decade is professional and business services; it is more than 20 percent larger in 2016 than in 2006. And the output of its professional, scientific and technical services subsector has grown by an impressive 47 percent.
Job growth varies by industry
Prior to the Great Recession, payroll employment in the Bloomington MSA tended to grow moderately each year. From 2000 through 2007, the area’s employers added more than 3,600 jobs, a 5.7 percent increase to 67,261. But from 2007 through 2016, they contracted by 811 jobs, with total employment hovering around 66,000 throughout most of this period.
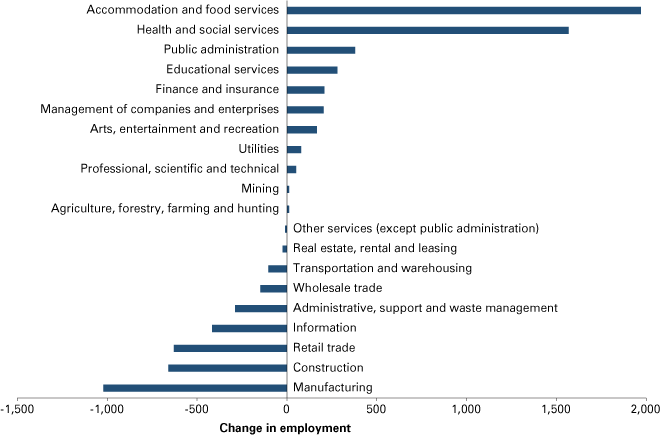
Total employment numbers, however, obscure notable differences across industries, as seen in Figure 2. The area’s largest sector by employment—manufacturing—has shrunk by more than 1,000 jobs since 2000, while construction and retailing each shed more than 600 jobs. On the other hand, some sectors added jobs, including two of the area’s largest sectors: accommodation and food services (+1,970) and health and social services (+1,568). And a relatively small but growing sector, management of companies and enterprises, nearly doubled in size from 215 jobs in 2000 to 419 in 2016, with most of the expansion occurring in just the last few years.
Figure 2: Growth and decline: Change in employment by industry for the Bloomington MSA, 2000 to 2016

Source: IBRC, using U.S. Bureau of Labor Statistics Quarterly Census of Employment and Wages (QCEW) data
Unemployment rate declining
Monroe County’s unemployment rate was under 3 percent in 2000, after which it started rising gradually for several years. Once the Great Recession began in 2007, however, the unemployment rate rose dramatically from 3.7 percent to peak at 7.9 percent in 2010. Since then, fortunately, the county’s unemployment rate has declined steadily to 4.6 percent in 2016. At this level, most of the area’s people who are looking for work have been able to find employment.
Personal income
An area’s personal income is the income received by, or on behalf of, all persons in the area from all sources, including employment, from owning a home or unincorporated business, from the ownership of financial assets, and from government and business in the form of transfer receipts (e.g., welfare and social security benefits).
The latest real personal income data show that per capita personal income (PCPI) in the Bloomington MSA grew 4.2 percent in 2015 from the previous year, a rise of $1,367 per person after adjusting for inflation. This uptick outpaced the national growth rate of just 3.3 percent. However, the national PCPI in dollars is substantially higher than Bloomington’s PCPI. The area’s large population of college students, most of whom do not have sizable incomes, tends to depress the MSA average.
Housing market holding its own
Monroe County home sale closings in 2017 through September were down slightly, by 0.9 percent, compared to 2016 figures. However, this dip was very small compared to the statewide drop of 2.8 percent. Meanwhile, the median price of homes sold in the county grew by 5.8 percent ($9,900), outpacing the statewide appreciation rate of 5.1 percent. The housing market appears to have heated up noticeably, with supply somewhat challenged to keep up with demand.
Where to from here?
The IBRC’s Center for Econometric Model Research forecasts Bloomington MSA employment growth of about 2,200 jobs in 2018—roughly a 2 percent gain. This is a faster pace of growth than is forecast for all but two of Indiana’s 14 metro areas. The forecast also anticipates Bloomington MSA personal income growth of nearly $300 million in 2018, along with modest population growth.
All in all, the outlook for 2018 is rather positive for Bloomington.


