Anderson forecast 2018

Dean, Falls School of Business, Anderson University
Overview
The new trend continues: After a slow start following the Great Recession, Madison County and the greater Anderson community continue a new trend, especially in comparison to the state. In place of persistent unemployment and a long-term decline in the number of jobs over the last few decades, the economic outlook has improved with lower unemployment rates, an increase in the number of jobs, a narrowing gap compared with Indiana as a whole and an increase in the percentage of adults with academic diplomas.
Employment and job creation
Year to year, the unemployment rate continues to fall. The unemployment rate for Madison County has fallen to less than a third of what it was in 2010. As shown in Table 1, the unemployment rate declined from a high of 12.1 percent in 2010 down to 3.9 percent as of September 2017.
Table 1: Annual average employment and unemployment rates
| Year | Madison County | Indiana | ||
|---|---|---|---|---|
| Employment | Unemployment rate | Employment | Unemployment rate | |
| 2010 | 52,243 | 12.1% | 2,845,608 | 10.4% |
| 2011 | 52,409 | 10.9% | 2,891,945 | 9.1% |
| 2012 | 52,202 | 10.0% | 2,905,549 | 8.3% |
| 2013 | 52,694 | 9.3% | 2,946,557 | 7.7% |
| 2014 | 53,817 | 7.1% | 3,035,178 | 5.9% |
| 2015 | 54,999 | 5.7% | 3,114,002 | 4.8% |
| 2016 | 56,621 | 5.0% | 3,179,806 | 4.4% |
| 2017* | 57,842 | 3.9% | 3,221,227 | 3.6% |
* 2017 data are as of September.
Note: Data are not seasonally adjusted.
Source: U.S. Bureau of Labor Statistics
The unemployment rate continued to drop over the course of 2017; however, the decline from the last few years slowed somewhat. As illustrated in Table 2, the unemployment rate for Madison County decreased from 4.3 percent in October 2016 to 3.9 percent as of September 2017.
Table 2: Monthly employment and unemployment rates
| Date | Madison County | Indiana | ||
|---|---|---|---|---|
| Employment | Unemployment rate | Employment | Unemployment rate | |
| October 2016 | 56,843 | 4.3% | 3,198,332 | 3.9% |
| November 2016 | 56,926 | 4.2% | 3,188,283 | 3.9% |
| December 2016 | 56,388 | 4.5% | 3,156,507 | 4.0% |
| January 2017 | 56,283 | 5.4% | 3,150,976 | 4.7% |
| February 2017 | 56,186 | 5.4% | 3,151,683 | 4.7% |
| March 2017 | 56,565 | 4.6% | 3,179,051 | 3.9% |
| April 2017 | 57,448 | 3.1% | 3,227,384 | 2.7% |
| May 2017 | 57,878 | 3.1% | 3,239,862 | 2.8% |
| June 2017 | 58,583 | 3.3% | 3,269,157 | 3.1% |
| July 2017 | 58,730 | 3.7% | 3,263,107 | 3.4% |
| August 2017 | 58,027 | 4.2% | 3,218,709 | 4.0% |
| September 2017 | 57,842 | 3.9% | 3,221,227 | 3.6% |
Note: Data are not seasonally adjusted
Source: U.S. Bureau of Labor Statistics
2017 has shown a significant increase in jobs. After long periods of stagnant and declining employment, the number of employed in Madison County showed healthy increases for the last five years. The number of employed (shown in Table 1) increased from 52,202 in 2012 to 57,842 as of September 2017. This represents an increase of 10.8 percent for Madison County and an increase of 10.9 percent for Indiana.
Jobs recovery ahead of Indiana for 2017: The improvement in employment numbers for Madison County was ahead of Indiana over the year from October 2016 to September 2017. As noted in Table 2, employment increased from 56,843 to 57,842 for Madison County, while the number of employed in Indiana increased from 3,198,332 to 3,221,227. Madison County improved the number of jobs by 1.8 percent over the 12-month period, while Indiana improved by 0.7 percent.
Closing the gap
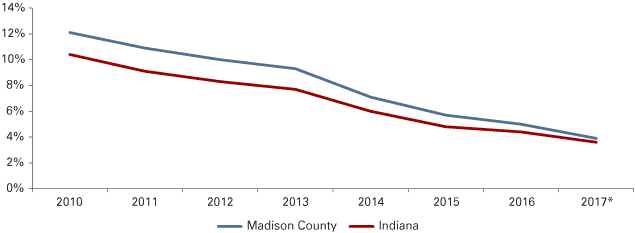
Unemployment rate: Over the last several years, Madison County has been closing the gap between its unemployment rate and the unemployment rate for Indiana. For decades, the Madison County unemployment rate trailed the state unemployment rate. However, that gap shows significant signs of closing. As shown in Figure 1, from 2010 to September 2017, the unemployment gap has narrowed considerably. The gap was nearly 2 percentage points in 2010 and has narrowed to less than 0.3 points.
Figure 1: Comparing Indiana and Madison County annual unemployment rates

* 2017 data are as of September.
Note: Data are not seasonally adjusted.
Source: U.S. Bureau of Labor Statistics
Stronger jobs growth rate: Over the last several years, both Madison County and Indiana delivered more jobs. As of September 2017, the number of employed in Madison County hit just under 58,000 as shown in Table 3. The 2017 year-over-year job growth rate for Madison County was right at 2.2 percent. This compares favorably to the 1.3 percent job growth rate for the state over the same time period.
Table 3: Annual average job growth
| Madison County | Indiana | |||
|---|---|---|---|---|
| Year | Employment | Year-over-year job growth | Employment | Year-over-year job growth |
| 2010 | 52,243 | 2,845,608 | ||
| 2011 | 52,409 | 0.3% | 2,891,945 | 1.6% |
| 2012 | 52,202 | -0.4% | 2,905,549 | 0.5% |
| 2013 | 52,694 | 0.9% | 2,946,557 | 1.4% |
| 2014 | 53,817 | 2.1% | 3,035,178 | 3.0% |
| 2015 | 54,999 | 2.2% | 3,114,002 | 2.6% |
| 2016 | 56,621 | 2.9% | 3,179,806 | 2.1% |
| 2017 | 57,842 | 2.2% | 3,221,227 | 1.3% |
* 2017 data are as of September.
Note: Data are not seasonally adjusted.
Source: U.S. Bureau of Labor Statistics
Falling population: The higher number of jobs in Madison County was accomplished during a time of falling population. As illustrated in Figure 2, Madison County and Indiana employment increased, along with Indiana’s population; however, the population of Madison County declined over that same period. Since 2010, the number of employed in Madison County rose by 10.7 percent while the population fell by almost 2 percent.
Figure 2: Employment and population comparison

Source: U.S. Census Bureau and U.S. Bureau of Labor Statistics
Education
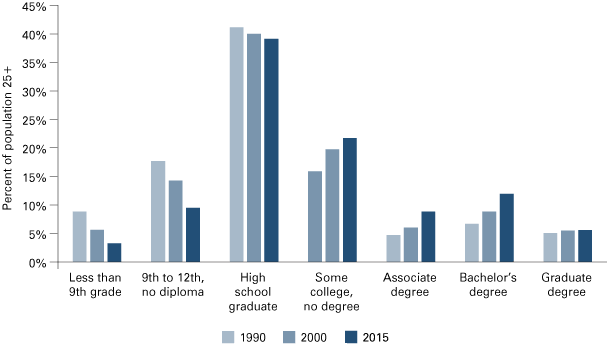
Improvements: Higher earning potential is often correlated to higher educational attainment. Over the last couple of decades or so, distinct improvements have been made in educational attainment in Madison County. Figure 3 shows the percentage of Madison County residents over 25 years of age with at least some college has improved in several categories, including associate, bachelor's and graduate degrees.
Figure 3: Madison County educational degree attainment

Note: 2015 data are the most recent available at the time of this writing.
Source: U.S. Census Bureau American Community Survey five-year estimates
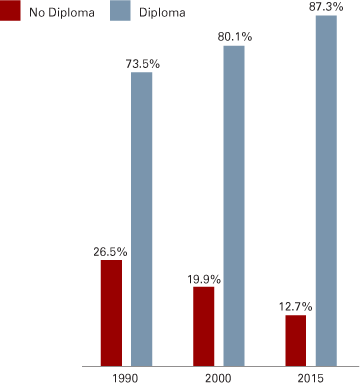
More diplomas: The proportion of the Madison County population over 25 years of age earning a high school diploma or higher has increased from 73.5 percent to 87.3 percent between 1990 and 2015 (see Figure 4). The percentage of Madison County residents 25 years of age and over not earning a high school or higher degree dropped from 26.5 percent in 1990 to 12.7 percent in 2015.
Figure 4: Madison County high school diploma attainment

Note: 2015 data are the most recent available at the time of this writing. This chart shows the percent of the adult population ages 25 and older.
Source: U.S. Census Bureau American Community Survey five-year estimates
Outlook for 2018
The overall 2018 forecast for Madison County employment is expected to continue its positive trend, but will begin to flatten out with only a slight decline in the unemployment rate and a moderate increase in employment.
The improvement will come primarily from three sources: an overall growing economy, the recent influx of new businesses and the growth of existing businesses.
Unemployment rate: The unemployment rate for Madison County is projected to hold fairly steady, perhaps falling another 0.2 percent to 0.5 percent in 2018. While the improving economy will continue to encourage previously frustrated unemployed people to reenter the labor force, another drop in the unemployment rate in Madison County is expected. The best estimate is an unemployment rate of about 3.7 percent for 2018. For the first time in decades, the unemployment rate for Madison County could match or beat the unemployment rate for the state of Indiana.
Jobs: The number of employed in Madison County is expected to have a modest increase of about 1.5 percent in 2018 with the number of jobs expected to hit just over 58,500. The 2018 full-year job growth in Madison County could once again match or exceed the job growth rate for Indiana.


