Housing: Positive outlook for 2018

Director of the IU Center for Real Estate Studies, Kelley School of Business, Indiana University
Demand for single-family housing will remain strong in 2018, mirroring 2017.
Positive job gains and attractive interest rates continue to bring buyers to the market. Consumer confidence remains high as employment growth remains positive, interest rates continue to be attractive, and consumers continue to improve their balance sheets. On the other hand, supply is struggling to keep up with demand, while builders struggle to produce enough homes to meet market demand. Moreover, where demand is strongest—for starter and lower-price homes—supply is weak and pricing pressure strong. It is difficult for builders to produce these homes because building costs prohibit it.
Coupling these realities with a good job market and continued low interest rates is resulting in pricing growth that outpaces inflation. In particular submarkets, with very strong demand characteristics and constrained supply, it is possible that unsustainable pricing exists. In summary, the 2018 housing market will experience strong demand, but buyers will be challenged by rising prices—especially if they are looking for starter or lower-priced homes.
For example, the National Association of Realtors forecasts that existing home sales will increase 6.9 percent from 2017 levels, while new single-family home sales will increase 17.1 percent nationally. In 2016, we saw existing home sales increase 3.8 percent, while 2017 experienced a 0.2 percent decrease (see Table 1). In contrast, new single-family homes saw increases of 12 percent and 6.6 percent, respectively, for 2016 and 2017.
Table 1: National housing outlook
| History | Forecast | |||
|---|---|---|---|---|
| 2015 | 2016 | 2017 | 2018 | |
| Home sales (thousands) | ||||
| Existing home sales | 5,250 | 5,450 | 5,437 | 5,810 |
| New single-family sales | 501 | 561 | 598 | 700 |
| Home sales (% change year ago) | ||||
| Existing home sales | 6.3% | 3.8% | -0.2% | 6.9% |
| New single-family sales | 14.6% | 12.0% | 6.6% | 17.1% |
| Median home prices ($ thousands) | ||||
| Existing home sales | $222.4 | $233.8 | $247.2 | $258.6 |
| New single-family sales | $296.4 | $316.2 | $315.4 | $327 |
| Median home prices (% change year ago) | ||||
| Existing home sales | 6.8% | 5.1% | 5.7% | 4.6% |
| New single-family sales | 4.8% | 6.7% | -0.3% | 3.7% |
| Affordability | ||||
| Housing affordability index* | 165.7 | 164.8 | 162.1 | 149.9 |
* The housing affordability index measures the ability of a family earning the median income to purchase a median-priced home. Higher index values indicate increased affordability.
Source: National Association of Realtors, “U.S. Economic Outlook: October 2017”
Housing starts are projected to increase 10.3 percent in 2018, with single-family units increasing 15.5 percent and multifamily units decreasing 2.3 percent. Median home prices for both existing and new homes are expected to increase 4.6 percent and 3.7 percent, respectively. The S&P CoreLogic Case-Shiller National Home Price Index (not seasonally adjusted) reported a 5.9 percent annual gain in home prices in July. Consumer prices are expected to increase 2.5 percent in 2018, up from 2.0 percent in 2017.
Considering the above statistics, one can see the strong demand and the resulting increase in pricing outpacing inflation. Also, one can reason the need for supply to catch up with demand to provide a more reasonable pace of home price increases. What one cannot know is the impact of these dynamics on particular submarkets that have very strong demand drivers, primarily positive job growth, and weak supply drivers, such as high building costs and a shortage of available land. In these markets, it is likely that prices are being driven to unsustainable levels considering the availability of low interest rates. In short, it is important for the housing market’s price stability that supply keep better pace with demand.
The likelihood of continuing improvement in the single-family housing market in our nation’s cities and towns largely depends on job growth and how wages compare to that locale’s housing prices. When differentiating single-family markets across the country, it is important to remember the key factor of mortgage qualification. That factor is a household’s monthly gross take-home pay relative to its payment for housing costs—the total of the mortgage payment, real estate taxes and home insurance. Holding all other things equal, communities with positive job growth and a favorable margin between wages and housing costs are more likely to experience a more stable single-family housing market than communities with more narrow home affordability.
In 2018, home affordability is expected to decrease across the country. The National Association of Realtors projects a change in this index from 162 to 150 from 2017 to 2018. Considering a positive outlook for employment and continued attractive interest rates, this relatively small reduction in affordability should have little impact nationally.
How will the Indiana housing market fare in 2018?
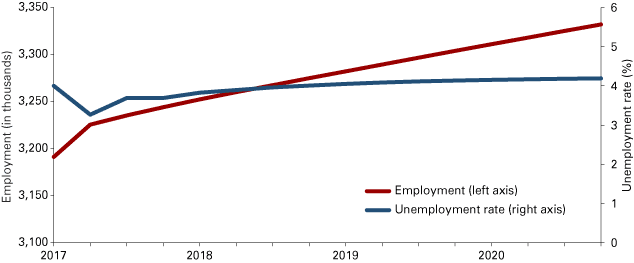
In terms of employment, Indiana is experiencing positive trends. According to the Indiana Business Research Center (IBRC) and the Center for Econometric Model Research (CEMR) at Indiana University, Indiana should realize an average annual gain of roughly 30,000 jobs per year between 2017 and 2020. Indiana's unemployment rate is expected to remain steady during this period (see Figure 1).
Figure 1: Indiana employment and unemployment rate forecast

Source: Indiana University Center for Econometric Model Research and Indiana Business Research Center (released in September 2016)
In terms of existing home sales, Indiana is projected to beat the nation by a 3 percentage point margin in 2017 compared to 2016. In residential building permits, Indiana outpaced the nation by only 1 percentage point. In contrast, during this same period, Indiana lagged the nation in home price appreciation. Indiana’s months supply of inventory lagged the nation by about a month as of September 2017 (see Table 2). Considering these results together, it demonstrates that Indiana needs to do a better job of adding single-family homes to the market. Otherwise, a shortage of inventory will drive prices higher and make it harder for some buyers to enter the market.
Table 2: Comparison of Indiana and U.S. housing markets
| U.S. | Indiana | |
|---|---|---|
| Existing home sales, 2016 to 2017, year-over-year change | -0.2% | 2.8% |
| House price appreciation, 2016 to 2017, year-over-year change | 5.7% | 5.1% |
| Residential building permits, August 2016 to August 2017, year-over-year change | 10% | 11% |
| Foreclosure rate, 2016 Q3 | 1.6% | 1.7% |
| Months supply of inventory, September 2017 |
5.0 | 4.1 |
| Housing affordability index, August 2017* | 149.9 | 261 |
* The housing affordability index measures the ability of a family earning the median income to purchase a median-priced home. Higher index values indicate increased affordability. The value shown for Indiana is an average of the available metros.
Source: IBRC, using data from the Indiana Association of Realtors, National Association of Realtors, Federal Housing Finance Agency, U.S. Census Bureau, Mortgage Bankers Association, and CoreLogic.
According to the Indiana Association of Realtors, Indiana’s year-to-date 2017 closed sales metric is trending higher than in 2016, while its median sale price increased 5.1 percent to $147,000 year to date (see Table 3).
Table 3: Indiana housing overview
| Sep 2016 | Sep 2017 | Percent change | Year-to-date 2016 | Year-to-date 2017 | Percent change | |
|---|---|---|---|---|---|---|
| Closed sales | 7,736 | 7,752 | 0.3% | 66,068 | 67,936 | 2.8% |
| Median sale price | $142,900 | $150,000 | 5.0% | $139,900 | $147,000 | 5.1% |
Source: Indiana Association of Realtors
When looking at housing costs, Indiana typically has stable housing values. That is, Indiana homeowners usually experience small swings in value as economic conditions and world events take hold year to year.
While Indiana slightly trailed the country in home price appreciation over the past year, as seen in Table 2, its foreclosure rate generally kept pace with the nation at 1.7 percent. Perhaps most importantly, Indiana’s housing affordability remains very attractive, with an affordability index around 261 compared to the nation’s index of approximately 150.
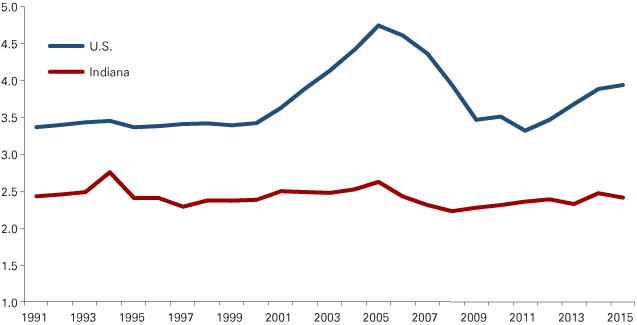
Considering the ratio of sales price to income has remained stable (see Figure 2) it follows that, year to year, Indiana generally provides a stable job base and a good wage relative to housing costs.
Figure 2: Ratio of median sale price to median household income

Source: Joint Center for Housing Studies at Harvard University, using data from Moody’s Data Buffet®
If Indiana’s economy continues its positive run through 2018, with more jobs and better wages, it will mean positive results for the housing market. However, the supply of homes needs to keep pace to provide buyers inventory and reasonable pricing. On the other hand, if job growth slows, wages stagnate or interest rates rise more than expected, Hoosiers will still fare well compared to less stable parts of the country.
Summary
Overall, the 2018 single-family housing market is looking positive for Indiana and the country. Job growth is steady and other economic fundamentals are positive. Thus, consumer confidence should be high. We forecast that 2018 should see the single-family housing market remain strong for both Indiana and the nation.


