Fort Wayne forecast 2018

Director of the Community Research Institute, Indiana University–Purdue University Fort Wayne
The Fort Wayne Metropolitan Statistical Area (MSA), which includes Allen, Whitley and Wells counties, is a legacy manufacturing region, with a strong manufacturing presence now. However, local leaders have been working to diversify the economy for the better part of 30 years.
Currently, local economic development leaders are looking to strengthen these industry clusters:1
- Vehicles
- Medical devices and technologies
- Specialty insurance
- Food and beverage processing and production
- Logistics including e-commerce and distribution
- Design and craftsmanship
- Advanced materials
The target clusters are not a comprehensive list of Fort Wayne’s employment base. Industries not in the clusters but with significant employment include health care, educational services and defense contracting.
Gross regional product: Making things makes Fort Wayne’s economy
Fort Wayne’s long history of manufacturing lives on in the gross regional product. Manufacturing is almost 27 percent of Fort Wayne’s 2016 private-industry real GDP, up from 20 percent in 2001, according to U.S. Bureau of Economic Analysis data.2 In comparison, just over 12 percent of national private-industry real GDP comes from manufacturing. The lion’s share of Fort Wayne’s manufacturing—almost 80 percent—comes from durable goods. However, about $11.8 billion of Fort Wayne’s real GDP is derived from the service side, compared to $4.67 billion in manufacturing.
In terms of real GDP, Fort Wayne’s economy grew 0.8 percent in 2016, compared to 1.7 percent growth for all U.S. metros. When compared to other Indiana and Midwestern metros, Fort Wayne’s economic performance was in the middle of the pack.
Labor force: Fort Wayne unemployment below state, national rate
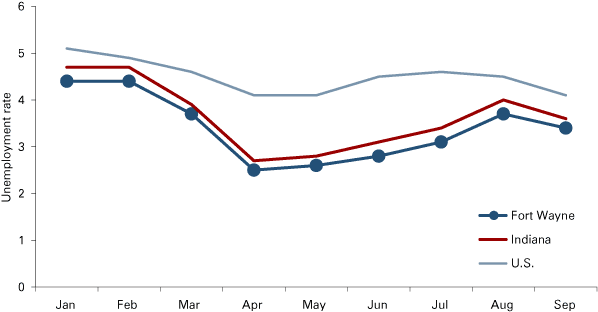
It was 2014 when the Fort Wayne MSA last experienced an annual unemployment average above 5 percent.3 And although the final numbers aren’t in yet for 2017, the area can expect to end the year at full employment. Fort Wayne enjoyed an unemployment rate below the national and state averages from January to September 2017 (see Figure 1).4
Figure 1: Fort Wayne MSA unemployment comparison, 2017

Source: Local Area Unemployment Statistics (LAUS) data from the U.S. Bureau of Labor Statistics and the Indiana Department of Workforce Development
In terms of Fort Wayne's labor force, it has varied from 210,812 in March to July’s 216,970.5 Employment peaked in June and July, with both months at just above 210,100. The number of unemployed ranged from 9,328 in January down to 5,204 in April.
Wages and income: Lagging behind state and nation
A persistent challenge facing Fort Wayne is lower-than-average wages. This is lower than the average for the state, other Indiana and Midwestern metros, as well as surrounding states (see Table 1).
Table 1: Average wage for metro areas and states, 2016
| Geography | Weekly | Annual |
|---|---|---|
| United States | $1,031 | $53,612 |
| States | ||
| Illinois | $1,086 | $56,472 |
| Michigan | $980 | $50,960 |
| Ohio | $917 | $47,684 |
| Indiana | $857 | $44,564 |
| Kentucky | $848 | $44,096 |
| Metros | ||
| Des Moines-West Des Moines MSA | $1,018 | $52,936 |
| Indianapolis-Carmel-Anderson MSA | $945 | $49,140 |
| Kalamazoo-Portage MSA | $925 | $48,100 |
| Dayton MSA | $885 | $46,020 |
| Elkhart-Goshen MSA | $881 | $45,812 |
| Grand Rapids MSA | $879 | $45,708 |
| Toledo MSA | $864 | $44,928 |
| Evansville MSA | $838 | $43,576 |
| South Bend MSA | $820 | $42,640 |
| Fort Wayne MSA | $818 | $42,536 |
| Muncie MSA | $717 | $37,284 |
Source: Quarterly Census of Employment and Wages (QCEW) data from the U.S. Bureau of Labor Statistics
While Fort Wayne residents may enjoy a lower cost of living when compared to large metros, namely for housing, the cost-of-living reduction doesn’t offset lower pay. For example, Fort Wayne’s average wage is about 80 percent of Des Moines’, yet the U.S. Bureau of Economic Analysis finds the price disparity for goods and services between the two cities in 2015 was only about 5 percent.6
Educational attainment: Our ticket to increased income?
The more education a person receives, the more money that person is likely to earn.7 Thus, increasing educational attainment could create higher-paying jobs in Fort Wayne.
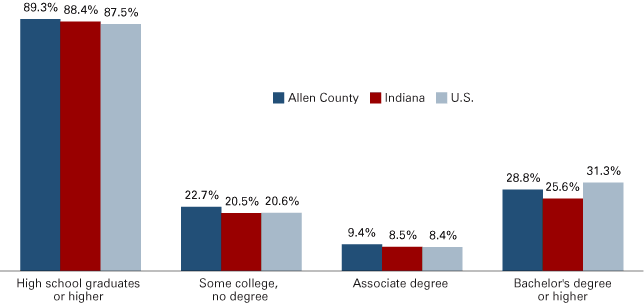
American Community Survey data show adults (25 and older) are becoming more educated, but Indiana and Allen County each differ from the national numbers.8 At the state and local level, residents with a high school diploma or higher exceed the national rate. It gets more interesting for the people who at least started college. More Allen County residents started college but haven’t earned a degree relative to Indiana and U.S. rates. The percentage with an associate degree is also slightly higher in Allen County (see Figure 2). This number fell in relative terms, presumably because more associate degree holders later earned a bachelor’s degree.
Figure 2: Educational attainment, 2016

Source: American Community Survey one-year estimates from the U.S. Census Bureau
Historically, Indiana has lagged the nation in those with a bachelor’s degree or higher and that continues with 2016’s data. A greater percentage of Allen County residents have a bachelor’s degree or higher relative to the state, but Allen County is behind the national rate in both 2005 and 2016.
Positive news comes when looking at the younger college graduates (ages 25 to 34) with a bachelor’s degree or higher. In 2005, Allen County exceeded the state but fell behind the nation. By 2016, Allen County’s 25- to 34-year-olds continued to outpace Indiana in degree attainment, and also now matched national rates when the margin of error is considered.
Looking ahead to 2018
Recent economic trends have been favorable to Fort Wayne’s manufacturing-heavy economy. The overall health of the American economy is solid. The question becomes: How much longer will this continue? We are in an extended stretch of American economic growth.9 The slight but persistent uptick in unemployment in the second and third quarters, especially with a corresponding increase in first-time unemployment claims, creates pause. Nevertheless, the low unemployment rate indicates the market may be able to absorb these newly unemployed workers, assuming their skills match open positions. One consideration is how to engage additional people in the labor force, especially in light of baby boomer retirements and a growing segment of prime-working-age men who are not working or seeking employment.
In terms of job growth, the challenge has been—and will continue to be—aligning workers with workforce needs. Projections from the Indiana Department of Workforce Development for the 11-county northeast region indicate an annual average of about 12,000 job openings, with 8,517 replacement openings and 3,699 new jobs.10
Notes
- Community Research Institute at IPFW, “Northeast Indiana Target Report,” June 2016, 19, https://assets.neindiana.com/resources/northeast-indiana-target-industry-report.pdf.
- U.S. Bureau of Economic Analysis, Regional Data Gross Domestic Product by Metropolitan Area (2017), www.bea.gov/news/2018/gross-domestic-product-metropolitan-area-2017.
- The 2014 annual average unemployment rate (not seasonally adjusted) was 5.6 percent for 2014, according to the Indiana Department of Workforce Development’s Local Area Unemployment Statistics, available at www.hoosierdata.in.gov.
- Data for September 2017 were the latest available at time of this writing.
- Using not seasonally adjusted LAUS data from the Indiana Department of Workforce Development.
- U.S. Bureau of Economic Analysis 2015 Regional Price Parities (June 22, 2017).
- See Timothy Slaper, “Finding New Cheese: Why Indiana’s Per Capita Personal Income Lags (and How to Fix It),” Indiana Business Review 88, no. 1 (Spring 2013): 4-7, www.ibrc.indiana.edu/ibr/2013/spring/pdfs/article1.pdf, and Nathan Law, “The Relationship between Educational Attainment and Wages,” Center for Business and Economic Research Information Brief, Ball State University (March 8, 2017): 3-4, https://projects.cberdata.org/reports/EduAndWage-20170308.pdf.
- See American Community Survey one-year estimates for 2005 and 2016, Table S1501, U.S. Census Bureau (2017).
- The National Bureau of Economic Research (NBER) indicates the national economy has been expanding since June 2009. The longest stretch was from March 1991 to March 2001.
- Based on the Indiana Department of Workforce Development Employment Outlook Projections, 2014-2024, for Economic Growth Region 3, http://hoosierdata.in.gov/FD/overview.aspx, accessed September 28, 2017.


