
Lafayette forecast 2022

Community Development Regional Extension Educator, Purdue University
The Lafayette Metropolitan Statistical Area (MSA) continues to be viewed as a booming area with its population growth and strong economic performance. During 2021, the Lafayette area received recognition as having one of the best housing markets. As expected, the data showed how resilient the MSA region was during the pandemic, despite large contractions and rebounds in the service-providing sectors between 2020 and 2021. Once additional data are released, more insight will be given toward the strength of the rebound in relation to income levels. Regardless, the current data point to continued growth in the Lafayette MSA, fettered only by the available labor force and housing stock.
The Lafayette MSA (defined in this article as Tippecanoe, Benton and Carroll counties unless otherwise noted)1 is projected to have a 2021 population of 228,723 individuals. As expected, the 2020 population estimates2 show that 84% of the MSA’s population reside in Tippecanoe County (196,115 residents) followed by Carroll County with 20,228 residents. Over the past decade (2010-2020), the Lafayette MSA has grown by 24,500 people or 12.2%. The MSA’s strong growth stems from the diverse economy in the Lafayette/West Lafayette area and the economic activity associated with Purdue University. This is especially apparent as the smaller surrounding counties continue to experience minimal growth or declining population numbers.
Since 2000, the MSA has expanded by 47,800 residents with 97.8% of that growth occurring in Tippecanoe County. This equates to nearly 2,300 new residents per year in Tippecanoe County. The Indiana University Center for Econometric Model Research (CEMR) projects an increase of 3,460 residents (1.5% growth) in the region in 2022, pushing the total population count to 232,187 individuals (see Figure 1).
Figure 1: Annual Lafayette MSA population
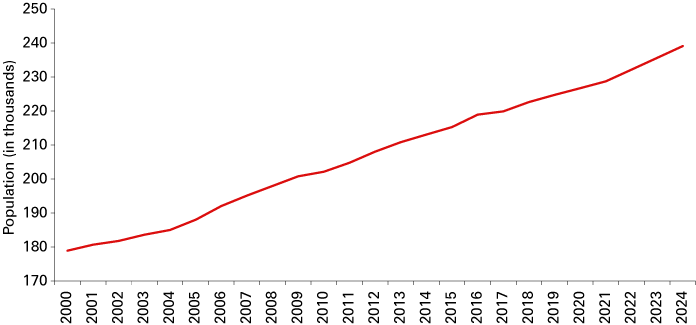
Note: Data for 2021 through 2024 are projections.
Source: U.S. Census Bureau and Indiana University Center for Econometric Model Research
Labor
As of September 2021, the Lafayette MSA began to see the labor force and employed numbers return to early 2020 figures. The unemployment rate was at 3.0%, a lower rate than Indiana (3.5%) and the nation (4.6%). The area began 2021 with 109,230 in the labor force and has seen that number grow to 112,292 individuals. As indicated in Table 1, as the year progressed, more individuals entered the labor force and became employed, thus the continuous drop in unemployment figures. As of September 2021, it’s worth noting that the region is only 2,500 individuals away from the number of employed individuals in November 2019, when the region had an unemployment rate of 2.8%.
The Lafayette MSA consistently had lower unemployment rates than the state and nation throughout 2020 and 2021. This was likely due to the local university returning to “normal” operations, the sizable quantity of essential workers and the number of employers who pivoted to allow workers to work remotely or safely in-person. It is known that employers are actively seeking more workers and the latest figures show that approximately 3,400 individuals are still looking for work.
Table 1: Labor force and unemployment for the Lafayette MSA
| Year | Month | Labor Force | Employment | Unemployed | Lafayette MSA unemployment rate | Indiana unemployment rate | U.S. unemployment rate |
|---|---|---|---|---|---|---|---|
| 2020 | August | 105,881 | 98,810 | 7,071 | 6.7 | 7.2 | 8.5 |
| September | 108,963 | 103,186 | 5,777 | 5.3 | 6.0 | 7.7 | |
| October | 110,612 | 105,429 | 5,183 | 4.7 | 5.1 | 6.6 | |
| November | 110,903 | 106,015 | 4,888 | 4.4 | 4.8 | 6.4 | |
| December | 110,542 | 106,273 | 4,269 | 3.9 | 4.4 | 6.5 | |
| Annual | 108,074 | 101,334 | 6,740 | 6.2 | 7.1 | 8.1 | |
| 2021 | January | 109,230 | 104,691 | 4,539 | 4.2 | 4.7 | 6.8 |
| February | 110,503 | 105,936 | 4,567 | 4.1 | 4.7 | 6.6 | |
| March | 110,331 | 105,895 | 4,436 | 4.0 | 4.6 | 6.2 | |
| April | 110,087 | 106,171 | 3,916 | 3.6 | 4.2 | 5.7 | |
| May | 111,120 | 106,650 | 4,470 | 4.0 | 4.5 | 5.5 | |
| June | 111,754 | 107,008 | 4,746 | 4.2 | 4.7 | 6.1 | |
| July | 108,489 | 104,463 | 4,026 | 3.7 | 4.3 | 5.7 | |
| August | 108,994 | 105,077 | 3,917 | 3.6 | 4.0 | 5.3 | |
| September* | 112,292 | 108,936 | 3,356 | 3.0 | 3.5 | 4.6 |
*Preliminary data
Source: U.S. Bureau of Labor Statistics
Looking forward to 2022, the MSA will likely face a continued tightening labor market, with employers seeking workers from a limited pool of candidates. It has been said that it is becoming an employee’s market where more power rests in their hands—which may be true if the prospective employee has the requisite skills for the available job market. We are seeing increasing entry-level wages, which may entice individuals to enter the labor force. Thus, it is predicted that the labor force will likely grow at modest rates and encounter an unemployment rate in the upper 2% range, thus indicating full employment.
Table 2 examines regional employment between 2020 and 2021 in the Lafayette MSA. In the first nine months of 2021, the MSA saw an increase of 2,700 jobs, or 2.8% growth. All sectors experienced employment growth. The majority of the job increases came from the service-providing sectors for a total of 2,033 jobs, with 944 of those jobs being in the leisure and hospitality sector. This is a reversal of the pandemic job losses. Manufacturing remains the largest sector in the Lafayette MSA, comprising 19% of all jobs. It also saw a 4.0% gain (+744 workers) in 2021.
Table 2: Lafayette MSA employment
| Industry | 2021* | Change since 2020 | Percent change, 2020-2021 |
|---|---|---|---|
| Total nonfarm | 101,589 | 2,789 | 2.8% |
| Total private | 76,156 | 2,856 | 3.9% |
| Goods-producing | 23,056 | 756 | 3.4% |
| Manufacturing | 19,244 | 744 | 4.0% |
| Mining, logging and construction | 3,811 | 11 | 0.3% |
| Service-providing | 78,533 | 2,033 | 2.7% |
| Private educational and health services | 13,622 | 422 | 3.2% |
| Trade, transportation and utilities | 14,622 | 722 | 5.2% |
| Leisure and hospitality | 9,744 | 944 | 10.7% |
| Professional and business services | 7,122 | 22 | 0.3% |
| Financial activities | 3,122 | -78 | -2.4% |
| Information | 611 | 11 | 1.9% |
| Other services | 4,256 | 156 | 3.8% |
| Government | 25,433 | -67 | -0.3% |
*January through September data annualized for 2021. September data are preliminary.
Source: U.S. Bureau of Labor Statistics
The CEMR forecasts anticipate an employment increase of 3.7%, or 4,587 jobs, in the Lafayette MSA for 2022 and continued employment growth in the region through 2024. Given the strong rebound in the service-providing sectors to recoup their 2020 losses, it is estimated that the growth will be realized more evenly in 2022 in both the goods-producing (manufacturing and construction) and service-providing sectors. If construction employers are able to find workers, their growth could outpace manufacturing, given the strong demand for housing in the Lafayette MSA.
First-quarter 2021 wage data is the most recent information we have at the time of this writing. Comparing it against first-quarter 2020 captures only the beginning of the economic contraction due to the pandemic, and it does not show the rebound that emerged in the second half of 2021 since those data have not been released yet. Between the first quarters of 2020 and 2021, average weekly wages decreased by 2.2% within the Lafayette MSA. This decrease was coupled with a 3.7% decrease in jobs. The most severe drop in weekly wages was in manufacturing (-16.3%). The sectors with the largest average weekly gains were in the finance and insurance (9.7%) and educational services (6.4%) sectors (see Table 3). As more data become available, it is anticipated that we will see an increase in wages as the economy continued to rebound. Looking forward into 2022, given the tightening labor market, wage increases will likely occur to retain and attract workers. Therefore, it is anticipated that small wage increases of around 1% may occur in 2022.
Table 3: Average weekly wages in the Lafayette MSA
| Industry | Average weekly wage, 2021 Q1 | Change in jobs since 2020 Q1 | Change in average weekly wage since 2020 Q1 |
|---|---|---|---|
| Total | $942 | -3.7% | -2.2% |
| Utilities | $1,969 | n/a | n/a |
| Finance and insurance | $1,501 | -1.9% | 9.7% |
| Management of companies and enterprises | $1,494 | 0.0% | -1.8% |
| Educational services | $1,314 | -7.9% | 6.4% |
| Professional, scientific and technical services | $1,261 | 6.5% | -1.4% |
| Wholesale trade | $1,157 | -5.3% | 2.1% |
| Manufacturing | $1,177 | -3.5% | -16.3% |
| Mining | $1,068 | n/a | n/a |
| Construction | $1,058 | -1.5% | 4.9% |
| Health care and social services | $923 | -0.5% | 3.2% |
| Public administration | $906 | -1.3% | -1.4% |
| Transportation and warehousing | $830 | -1.7% | -5.0% |
| Information | $804 | -16.9% | -0.5% |
| Agriculture, forestry, fishing and hunting | $797 | 3.0% | -3.2% |
| Real estate and rental and leasing | $785 | -5.0% | -4.3% |
| Other services (except public administration) | $697 | -7.4% | 0.6% |
| Retail trade | $554 | -0.5% | 4.3% |
| Administrative, support, waste management and remediation | $546 | 4.9% | -4.0% |
| Accommodation and food services | $319 | -9.5% | 0.6% |
| Arts, entertainment and recreation | $282 | -25.4% | 4.4% |
Note: Data for mining and utilities were nondisclosable.
Source: STATS Indiana, using Quarterly Census of Employment and Wages data
The Lafayette MSA had a 1.3% growth in its per capita personal income (PCPI) between 2018 and 2019. Nationally, PCPI is $59,510; the region consistently lags behind the nation’s PCPI due to a different occupational mix and lower pay scales at the highest earning tiers. Additionally, the greater Lafayette area is a college town, with large numbers of people generating minimal income—which pulls down the PCPI figure. The PCPI gap between the Lafayette MSA and nation widened between 2018 and 2019; at 67.5% of the national figure, it falls short by $19,346. Compared to statewide figures, the MSA lags Indiana’s PCPI by $11,762. Despite these gaps between national and state figures, the region’s PCPI has grown by 29.1% since 2010. The 2021-2024 projection for the MSA’s total personal income shows a 5.6% annual growth.
Housing
As of September 2021, the year-to-date figures for the real estate market in the Lafayette MSA marked modest changes in its number of listings (1.3%), quantity of closed sales (4.2%) and inventory of homes for sale (-3.5%), as shown in Table 4. Carroll and Tippecanoe counties had higher median sale prices than in 2020, while Benton County had a tiny decline. The three counties have different housing stories at the moment—Benton had a slight increase in housing inventory, Tippecanoe continues to decline and Carroll remains stagnant. Homes that are available to sell in Carroll and Tippecanoe counties are selling at higher prices, likely due to demand. These trends are following predictions and the expected trends. The Lafayette MSA’s housing market will keep tightening and prices will be pushed upward due to lack of supply of homes.
Table 4: Lafayette MSA residential real estate sales
| Indicator | Lafayette MSA | Benton County | Carroll County | Tippecanoe County | ||||||||
|---|---|---|---|---|---|---|---|---|---|---|---|---|
| 2020 | 2021 | Change | 2020 | 2021 | Change | 2020 | 2021 | Change | 2020 | 2021 | Change | |
| New listings | 2,279 | 2,309 | 1.3% | 73 | 88 | 20.5% | 133 | 173 | 30.1% | 2,073 | 2,048 | -1.2% |
| Closed sales | 1,891 | 1,970 | 4.2% | 69 | 72 | 4.3% | 102 | 144 | 41.2% | 1,720 | 1,754 | 2.0% |
| Median sale price | n/a | n/a | n/a | $117,200 | $117,000 | -0.2% | $131,750 | $172,250 | 30.7% | $193,200 | $218,000 | 12.8% |
| Months supply of inventory | n/a | n/a | n/a | 2.5 | 2.6 | 4.0% | 1.5 | 1.1 | -26.7% | 1 | 0.9 | -10.0% |
| Inventory of homes for sale | 227 | 219 | -3.5% | 18 | 22 | 22.2% | 18 | 18 | 0.0% | 191 | 179 | -6.3% |
Note: Data reflect January to September for both years. Months supply of inventory and inventory of homes for sale are September values.
Source: Indiana Association of Realtors and Realtor.com Economic Research
Nationally, the housing market is expected to continue to see rising prices, albeit at a slightly slower pace. This is being driven by low mortgage rates and standards, an ongoing inventory shortage and the work-from-home trend driving individuals to purchase homes instead of renting near their places of employment. Millennials are still a driving force in purchasing new homes, and low interest rates are certainly helping create a sellers’ market. Residential construction builders (of both single-family and multifamily units) are still experiencing high demand for new construction, but face challenges with volatile costs (lumber, steel, drywall, etc.) and shortages of buildable lots and skilled labor.
The Lafayette MSA has had persistent declines in housing inventory; thus, one would expect increasing numbers of housing permits. Interestingly, in 2019, the number of permits issued dropped slightly, with only a minimal uptick in 2020. Thus, the four-county MSA region (including Warren County) had 1,397 permits issued in 2020 (see Figure 2). Between 2018 and 2020, 67% of the permits were for large housing units (five-or-more family units), reflecting the flurry of apartment and condominium housing units being built on the Purdue campus and within the greater Lafayette area. Over the past decade (2010-2020), more than 11,100 housing permits have been issued to build single-family homes relative to the 5,000 housing permits for 5-or-more family units. Given the rapid increase in lumber costs in 2021, the number of housing permits will likely be lower than normal. The variability in costs may negatively impact the number of housing permits issued in 2022 as well, but that may be overridden by strong demand depending on the ability of individuals to afford building a new home.
Figure 2: Lafayette MSA residential building permits
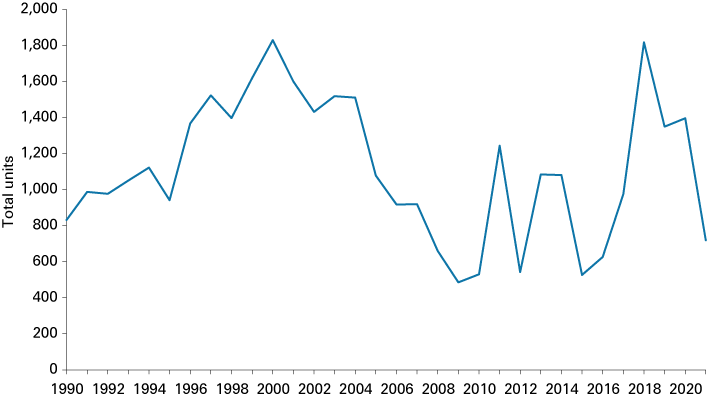
Note: 2021 reflects year-to-date figures through September 2021 for the MSA. The MSA region shown in this chart includes Benton, Carroll, Tippecanoe and Warren counties.
Source: STATS Indiana, using U.S. Census Bureau data
Conclusion
In 2021, the Lafayette MSA certainly did rebound from the sharp contractions due to the pandemic. The number of individuals in the labor force and employed is representative of numbers seen before the pandemic and close to full employment figures. The service-providing sectors experienced the strongest rebound as restrictions eased. However, growth occurred across all sectors. Income data reflect the impact of the 2020 contractions and, as more data are released, additional insight will be available concerning the rebound of personal income levels. In 2022, the Lafayette MSA has the ability to continue growing, but may be challenged by a tight labor market and housing availability.
Notes
- Warren County was added to the Lafayette MSA in the 2018 metro delineations. However, federal databases still mostly report based on the older delineation.
- Population estimates were used instead of 2020 census counts due to the large difference in figures, likely caused by college students not being counted due to COVID-19 and campus closures. At the time of this writing, the appeals process has not been completed, which may impact final 2020 census counts.
