Columbus forecast 2021

Visiting Associate Professor of Management, Indiana University Division of Business, IUPUC
The Columbus Metropolitan Statistical Area (MSA) has long supported a strong manufacturing-based economy linked to the transportation industry and light vehicle manufacturing. While structural changes have occurred over the years, dependence on these two industries continues as Columbus MSA gross domestic product (GDP) has been more than 50% durable goods manufacturing based since 2012.1 Columbus has experienced six years of solid economic growth starting in 2010, with two years of GDP decline in 2014 and 2015.2 With the continuing pandemic, weak business investment plans, a challenging year for Cummins and fewer light vehicle sales in North America, Columbus should conclude 2020 with lower GPD and higher unemployment than the prior year. Current projections are for the local economy to rebound during 2021 in light of mixed economic indicators.
Key measures
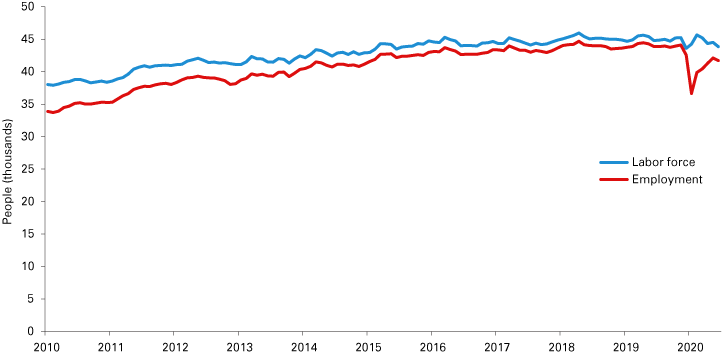
Employment and labor force: From 2011 to 2018, the Columbus MSA experienced nonfarm job growth between 100 and 4,100 annually, resulting in a total increase of 9,800 jobs. However, employment declined by 100 jobs in 2019 followed by a decline of 2,700 jobs in the first nine months of 2020, based on the Current Employment Statistics data set from the U.S. Bureau of Labor Statistics (BLS).
Figure 1 shows labor force and nonfarm jobs for the region from the Local Area Unemployment Statistics (LAUS) data set (also produced by BLS).
Figure 1: Labor force and nonfarm jobs in the Columbus metro
Note: Data are shown through September 2020 and are not seasonally adjusted.
Source: Local Area Unemployment Statistics, U.S. Bureau of Labor Statistics
In 2018 (the latest commuting data available), Columbus attracted approximately 13,265 workers (or 20% of the workforce) from outside the county (including Johnson, Jackson, Jennings, Brown and Marion counties).3 Based on the same 2018 data, approximately 5,100 Bartholomew county residents commuted to Jackson, Marion, Johnson and Decatur for their jobs. Approximately 13,000 workers from outside Columbus will continue to be required for staffing local firms; therefore, commuting patterns would be expected to remain relatively stable. However, labor supply pressures are expected to continue to increase as new employers enter markets in surrounding counties.
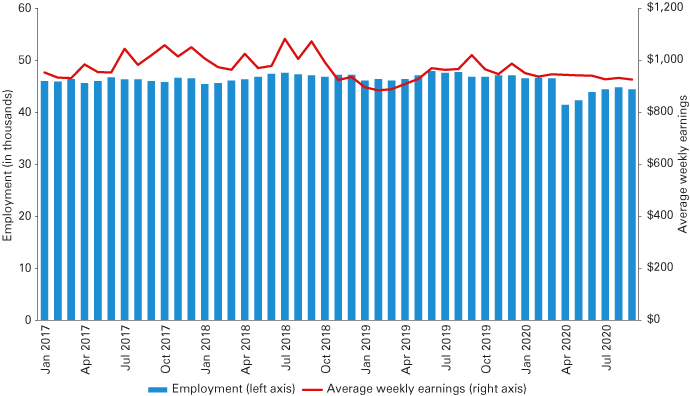
Weekly earnings: Average weekly earnings for the Columbus MSA experienced a 36% growth from a low of $730 in 2009 to $996 in 2018.4 As the labor market tightened between 2014 and 2018, weekly earnings increased in aggregate 7%, while inflation (measured by national CPI-U) impacted consumer spending power by 5.7% during the same period.5 However, 2019 reflected a 5% decline in weekly earnings from 2018. The average for the first nine months of 2020 reflects an approximate 1% decline from the 2019 average annual weekly earnings. Figure 2 shows the monthly employment and earnings data since 2017.
Figure 2: Employment and average weekly earnings in the Columbus MSA
Note: Data are shown through September 2020.
Source: Current Employment Statistics, U.S. Bureau of Labor Statistics and Indiana Department of Workforce Development
Average weekly hours climbed from 37.4 hours per week in 2016 to the highest level in over 10 years of 40.2 hours per week in 2018, before declining to 37.6 hours per week in 2019 and 36.6 hours per week in the first nine months of 2020. The rate of growth for average hourly earnings has changed from +3.7% in 2015 to -4.5% in 2018, followed by a 1.4% increase in 2019.6 Average hourly earnings have increased in 2020 with September 2020 (year-to-date) reflecting a 3% increase from September 2019 (year-to-date).
Unemployment: The pandemic lockdown spiked unemployment in the U.S., Indiana and Columbus in April to double digits. As the nation recovers from the economic disruption, the unemployment rate for the U.S. declined to 7.9% in September 2020. Indiana’s unemployment rate for September 2020 (not seasonally adjusted) was 5.8%. Columbus’ September 2020 unemployment rate was 4.9% (not seasonally adjusted) after peaking at 17.2% in April 2020.7 The Columbus MSA unemployment rate is slightly lower than any of the counties contiguous to Bartholomew, reflecting the solid employment base in this county.
Table 1, which shows selected Indiana metros and micros, highlights that the local unemployment rates remain lower than the national average in the aftermath of the pandemic shutdown.
Table 1: September unemployment rate comparison for selected Indiana metros and micros
| 2013 | 2014 | 2015 | 2016 | 2017 | 2018 | 2019 | 2020 | |
|---|---|---|---|---|---|---|---|---|
| U.S. | 7.0% | 5.7% | 4.9% | 4.8% | 4.1% | 3.6% | 3.3% | 7.7% |
| Indiana | 6.9% | 5.4% | 4.2% | 4.1% | 3.3% | 3.1% | 2.8% | 5.8% |
| Bloomington | 6.3% | 5.3% | 4.2% | 4.2% | 3.2% | 3.1% | 2.6% | 4.5% |
| Columbus | 5.2% | 3.9% | 3.0% | 3.1% | 2.5% | 2.3% | 2.0% | 4.9% |
| Evansville | 6.3% | 4.8% | 3.6% | 3.8% | 2.9% | 2.9% | 2.6% | 5.2% |
| Greensburg | 7.6% | 5.8% | 4.4% | 4.3% | 3.7% | 3.3% | 3.1% | 5.3% |
| Indy-Carmel-Anderson | 6.6% | 5.2% | 3.9% | 3.8% | 3.1% | 3.0% | 2.6% | 6.0% |
| Kokomo | 7.2% | 5.6% | 4.2% | 4.0% | 3.4% | 3.3% | 3.2% | 7.3% |
| North Vernon | 7.9% | 5.7% | 4.1% | 4.1% | 3.3% | 3.1% | 2.4% | 5.0% |
| Seymour | 5.8% | 4.5% | 3.5% | 3.4% | 2.8% | 2.7% | 2.2% | 4.7% |
Note: Data are not seasonally adjusted. Red cells indicate the highest rate and green cells indicate the lowest rate for each year.
Source: Local Area Unemployment Statistics, U.S. Bureau of Labor Statistics
Planned business investment: Columbus firms began reducing their business investment spending plans in 2019. The Greater Columbus Economic Development Board data indicates nine projects were planned in 2019 totaling $65 million followed by six planned projects so far in 2020 for $28 million. Since 2015, an estimated $565 million of planned investment in the Columbus MSA was projected to create an estimated 944 jobs (see Table 2). With the planned investments announced in 2020, the slowdown in business investment may reflect a cautious perspective by local businesses.
Table 2: Columbus MSA planned business investment announcements
| Year | Number of expansions | Planned investment ($ millions) | Number of employees |
|---|---|---|---|
| 2008 | 3 | 16.05 | 511 |
| 2009 | 0 | 0 | 0 |
| 2010 | 11 | 23.68 | 515 |
| 2011 | 9 | 35.52 | 945 |
| 2012 | 15 | 52.41 | 199 |
| 2013 | 18 | 135.98 | 884 |
| 2014 | 11 | 52.64 | 130 |
| 2015 | 9 | 153.15 | 171 |
| 2016 | 7 | 103.76 | 79 |
| 2017 | 6 | 80.73 | 91 |
| 2018 | 8 | 135.38 | 189 |
| 2019 | 9 | 64.75 | 352 |
| 2020* | 6 | 27.73 | 62 |
* Announced
Source: Greater Columbus Economic Development Board
Economic indicators
Of particular interest to the Columbus area, interest rates influence the demand for durable goods. Automobile and transportation-related purchases decline as interest rates rise due to higher ownership costs and a lower number of consumers qualifying for purchase. However, interest rates peaked in November 2018 and have declined through 2019 and into 2020. Currently, the Federal Reserve target for the federal funds rate is at or near zero.8
Vehicle and light truck sales worldwide peaked in 2017 then declined by less than 1% in 2018, followed by an approximately 4% decline from 2018 to 2019.9 Worldwide new vehicle sales are forecast to decline by approximately 15% in 2020.10 Similarly, light vehicle sales in the U.S. declined in 2019 by approximately 1% and are projected to decline an additional 15% to 20% for 2020.11 This trend can be seen in Figure 3.
Figure 3: U.S. monthly vehicle sales with annual trend line
Favorable for the U.S. vehicle and light truck industry, inventories appear to be under control with an inventory to sales ratio below 2.5 (see Figure 4). Unfortunately, with the pandemic, the aging of the U.S. fleet has continued with the average age at a high of 11.9 years.12 However, as cars and light trucks continue to age, replacement will be necessary.
Figure 4: U.S. monthly vehicle inventory/sales ratio
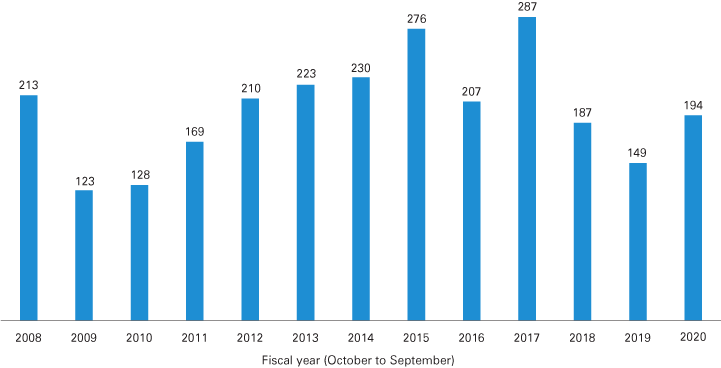
Local building permits: After a strong fiscal year 2017 for building permits in Columbus (287 permits), residential building permits declined in fiscal years 2018 and 2019, followed by an increase of 30% in 2020 (see Figure 5). The fiscal year 2020 data reflects an increase in building permits (68) in the October through December time frame from a below-average performance in the same period in fiscal year 2019 (28). The number of building permits in the January to September period of fiscal year 2020 (126) was slightly above the 2019 level (121). Because the building permits growth rate is a leading indicator of economic activity, the increase in building permits in 2020 may constitute a good omen for the Columbus MSA going forward.
Figure 5: Local fiscal year building permit trends for the Columbus MSA
Source: U.S Census Bureau
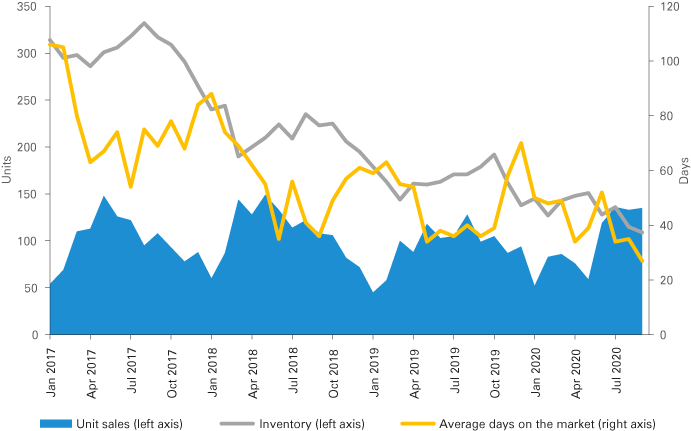
Residential housing sales: Residential sales remained steady at approximately 1,000 units during the first nine months of the year from 2015 to 2018, then declined to less than 900 in the first nine months of 2019 and 2020. As unit sales declined to this lower level, the average days on the market declined for the first nine months of each year from an average of about 77 days in 2017 to 41 days in 2020 (see Figure 6). The reduction in days reflects a tightening of inventory alongside less new construction available for sale. Also noteworthy, the average median price has increased from $172,000 in 2017 to $189,000 in 2020.
Figure 6: Columbus MSA real estate sales, inventory and average days on the market
Note: Data are shown through September 2020.
Source: Metropolitan Indianapolis Board of Realtors, National Association of Realtors and Indiana Association of Realtors
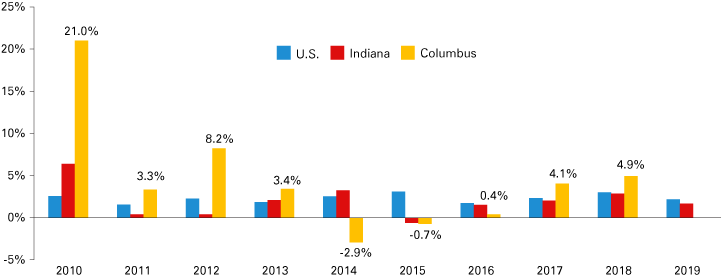
Local real GDP growth: Chained GDP for Columbus increased by nearly 5% in 2018 (see Figure 7). From 2011 to 2018, Columbus chained GDP has increased by an average of approximately 3% per year. This period includes the GDP declines for Columbus in 2014 and 2015, when the local economy contracted due to the heavily manufacturing-based economy.
Figure 7: Year-over-year chained GDP growth
Source: U.S. Bureau of Economic Analysis (chained GDP)
Following the declines in 2014 and 2015, the average rate of GDP growth in Columbus has increased the past three years, performing above the average GDP growth rates for the nation, state and several other Indiana metros—including Bloomington and Indianapolis (see Table 3). The fluctuations in GDP change noted for Columbus is reflective of the cyclical nature of a manufacturing/durable goods–based economy.
Table 3: Annual GDP growth rate comparison for selected Indiana metros
| 2014 | 2015 | 2016 | 2017 | 2018 | 10-year average | 3-year average | |
|---|---|---|---|---|---|---|---|
| United States | 2.5% | 3.1% | 1.7% | 2.3% | 3.0% | 1.8% | 2.3% |
| Indiana | 3.3% | -0.6% | 1.5% | 2.0% | 2.8% | 1.1% | 2.1% |
| Bloomington | 3.9% | -0.5% | 1.9% | 3.6% | 2.0% | 1.5% | 2.5% |
| Columbus | -2.9% | -0.7% | 0.4% | 4.1% | 4.9% | 2.5% | 3.1% |
| Evansville | -2.0% | -0.9% | -0.3% | 1.6% | 0.6% | 0.0% | 0.6% |
| Indianapolis-Carmel-Anderson | 3.6% | -1.7% | 2.3% | 1.9% | 2.1% | 0.9% | 2.1% |
| Kokomo | 1.7% | -0.4% | 0.3% | 4.9% | -0.3% | 4.9% | 1.6% |
Note: Shaded cells indicate declines.
Source: U.S. Bureau of Economic Analysis (chained GDP)
Outlook
Recovering employment, the potential for federal stimulus and near-zero Federal Reserve interest rates should support consumer spending that will lead to quickly recovering new vehicle sales, strong durable goods orders and stable home sales. However, political uncertainty with changing federal policies, continuation of the impact of the pandemic on the health care system and low consumer sentiment not seen since 2012-2013 cloud the outlook for 2021.
Leading general indicators
Upside potential
- U.S. light vehicle sales are forecast to recover from 2020 to around 17 million vehicles for 2021.13
- Durable goods orders increased in 2020 following the declines in March and April.14
- Columbus MSA GDP for 2018 (most recently available data) increased at its fastest rate since 2012.
- The PMI first fell below 50 in August 2019 and then again in March 2020 after rebounding slightly in January and February. However, the PMI has rebounded for the fifth consecutive month in September 2020 to 55.4%. Levels above 50 indicate the manufacturing economy is generally expanding.
- Cummins stock (CMI) has improved in 2020 from a low of $124 in March to $232 in October. This improvement occurred in contrast to the second and third quarter revenues and earnings. The improvement in stock price may reflect investor support of company efforts toward innovation and consistency.
Cummins: Cummins celebrated its 100th year since its founding in 1919. Cummins continues to be the leading manufacturer of commercial diesel engines in North America, with approximately a 40% market share—more than double the nearest competitor.15 Importantly, the U.S. and Canada account for approximately 60% of the company’s sales. Cummins revenues for the first nine months of 2020 were down 20% from the prior year, with profitability also following this trend.16 Lower North American sales drove the lower revenue.
In the third quarter of 2020, Cummins posted sales of $5.1 billion (down 11% from the third quarter of 2019), with North American markets down 20% and international business essentially flat. Net income in the third quarter of 2020 was $501 million, down 20% from the third quarter of 2019.17 All segments experienced declines in the third quarter.
The 2021 outlook for Cummins should reflect an increase in revenue and profits, returning to 2017 levels.
Downside potential
- Residential housing sales and building permits continue to exhibit weakness.
- Consumer sentiment continues at reduced levels not seen since 2012-2013 due to uncertainty surrounding the pandemic and the election year.
- The Columbus Economic Development Board announced in 2020 that six businesses in Columbus plan to spend about $28 million for expansion, potentially creating 62 new jobs. This is the lowest level of planned investment in Columbus since 2010.
- Continuing the sentiment from the 2020 forecast, Columbus continues to have a high rate of labor force participation, relatively low unemployment and competitive weekly earnings. With the introduction of additional competitors for employees, GDP growth may be hindered by the lack of population growth and the number of unfilled jobs.
Forecast
Columbus is expected to experience positive real GDP growth for 2021 of 2.5% to 3.5% based on recovery in new vehicle sales and strength in durable goods, with performance strongest in the second half of the year. Risks exist that might lead to weaker results. Continued uncertainty in the nation’s capital, lack of a federal fiscal stimulus focused on consumers, trade uncertainty, fewer local building permits on file, tightening of business investment and a further tightening of the local labor market will challenge GDP growth. Yet, local wage recovery should support the consumer segment of GDP.
Unemployment is expected to decrease slightly to 3.0% to 4.0% in 2021, with new participants entering into a job market with overall employment returning to 2017 levels. This will be complicated by continued challenges for the hospitality industry in the first half of 2021. The quick recovery of U.S. light vehicle sales in 2020 should influence production in 2021. Any negative economic pressures will be somewhat offset by strong average weekly wages, which may spur retail sales and keep durable goods sales levels increasing.
The current pandemic was a shock to the U.S. economy. How the U.S. overcomes this health-related shock and the nation’s political uncertainty remain as dynamic variables within the presented projections.
Notes
- U. S. Bureau of Economic Analysis data retrieved October 10, 2020, from https://apps.bea.gov/itable/iTable.cfm?ReqID=70&step=1
- See note 1.
- Annual commuting trends profile. (2020, April 7). STATS Indiana. Retrieved from www.stats.indiana.edu/dms4/commuting.asp
- Source: STATS Indiana, using U.S. Bureau of Labor Statistics and Indiana Department of Workforce Development data.
- U.S. Bureau of Labor Statistics. Chained CPI for all urban consumers, U.S. city average (CPI-U). Retrieved October 28, 2020, from https://beta.bls.gov/dataViewer/view/timeseries/SUUR0000SA0;jsessionid=70F671D920FD8544909A6AC4F80F1212
- Employment, hours & earnings (CES). (2020). STATS Indiana. Retrieved October 14, 2020, from www.stats.indiana.edu/ces/ces_naics/
- Labor force time series (NSA). (2020). STATS Indiana. Retrieved November 4, 2020, from www.stats.indiana.edu/laus/laus_view3.html
- Federal Reserve. (2020, March 16). Policy tools: Open market operations. Board of Governors of the Federal Reserve System. Retrieved from www.federalreserve.gov/monetarypolicy/openmarket.htm
- 2005-2019 sales statistics. (2020). OICA. Retrieved October 30, 2020, from www.oica.net/category/sales-statistics/
- Global car sales by key markets, 2005-2020. (2020, May 17). International Energy Agency. Retrieved from www.iea.org/data-and-statistics/charts/global-car-sales-by-key-markets-2005-2020
- Cox Automotive October forecast: U.S. auto sales achieve sixth straight month of growth. (2020, October 28). Retrieved from www.coxautoinc.com/news/oct-2020-cox-automotive-u-s-auto-sales-forecast/
- Associated Press. (2020, July 28). Average age of U.S. vehicles rises as pandemic forces Americans to hang on to their cars. MarketWatch. Retrieved from www.marketwatch.com/story/average-age-of-us-vehicles-rises-as-pandemic-forces-americans-to-hang-on-to-their-cars-2020-07-28
- United States total vehicle sales. (2020). Trading Economics. Retrieved October 30, 2020, from https://tradingeconomics.com/united-states/total-vehicle-sales
- Monthly advance report on durable goods manufacturers’ shipments, inventories and orders: September 2020. (2020, October 27). Retrieved from www.census.gov/manufacturing/m3/adv/pdf/durgd.pdf
- Wagner, I. (2018, December 13). Diesel engines in U.S.-built trucks: Manufacturers’ share 2015. Statista. Retrieved from www.statista.com/statistics/245391/market-share-of-diesel-engines-installed-in-us-built-trucks/
- Cummins, Inc. (2020, October 27). Cummins reports third quarter 2020 results. Cummins. Retrieved from https://investor.cummins.com/news/detail/486/cummins-reports-third-quarter-2020-results
- See note 16.


