South Bend and Elkhart forecast 2021

Director of the Bureau of Business and Economic Research and Professor of Economics, Judd Leighton School of Business and Economics, Indiana University South Bend
Due to the unprecedented COVID-19 pandemic, Indiana announced a statewide lockdown to contain the virus in late March and then eased the restrictions beginning in May. As a result, the local economy, which consists of the South Bend-Mishawaka and Elkhart-Goshen metropolitan statistical areas (MSAs), was severely affected by the pandemic in 2020. Gross domestic production (GDP) of both areas dropped dramatically in April and May, but has rebounded since June 2020.1 Both areas also saw a sizable decline in their labor force, sharp falls in employment, and dramatic rises in unemployment in 2020. However, the local cost of labor continued to rise during the pandemic period. The St. Joseph housing market slowed down the pace of new home construction, whereas existing home sales remained virtually unchanged with a higher median sales price.
Labor force and employment
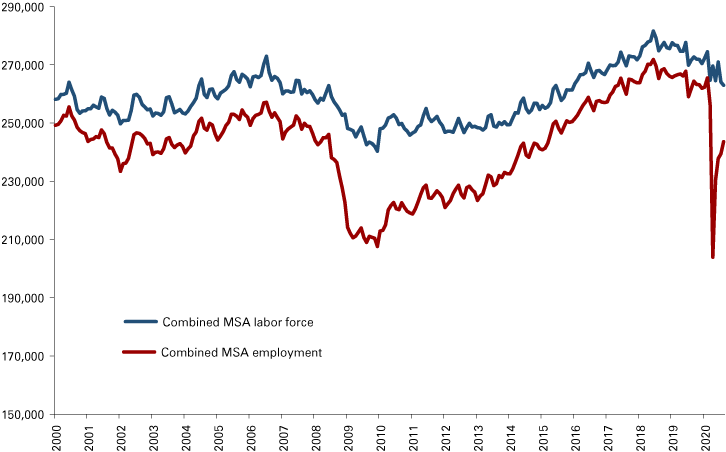
According to the household survey data from the U.S. Bureau of Labor Statistics (BLS), the combined region's average labor force, which includes the South Bend-Mishawaka and Elkhart-Goshen MSAs, fell by 6,964 in January-August 2020 to 267,953 (as compared to the same time period in 2019).2 The monthly trends of the labor force and employment of the combined region are illustrated in Figure 1.3 In particular, the labor force declined in both areas—by 3,244 in South Bend-Mishawaka and 3,720 in Elkhart-Goshen, respectively.
The combined region's average monthly employment was 242,395 in 2020, declining by 8.5% over the year. The loss of jobs was 12,290 (-7.9%) in the South Bend-Mishawaka MSA and 10,331 (-9.4%) in the Elkhart-Goshen MSA. Both MSAs suffered a higher rate of loss in their employment than the national and state data. From 2019 to 2020, the U.S. saw employment fall by an average of 6.4%, and Indiana saw its employment fall by 6.0%.
Figure 1: Labor force and employment in the South Bend-Mishawaka and Elkhart-Goshen MSAs combined

Note: Data are shown through August 2020 and are not seasonally adjusted.
Source: STATS Indiana, using Bureau of Labor Statistics data
Unemployment
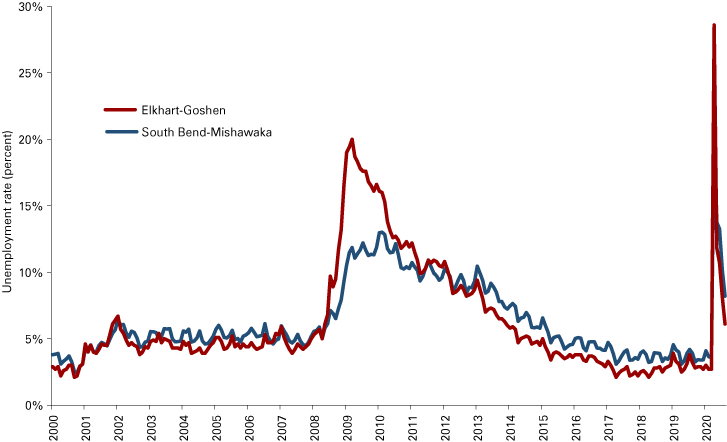
Figure 2 displays the unemployment rates in the South Bend-Mishawaka and Elkhart-Goshen MSAs from January 2000 to August 2020. The average monthly unemployment rate of South Bend-Mishawaka soared to 9.7% in 2020, 5.9 percentage points higher than the average unemployment rate in 2019. Similarly, the average jobless rate in Elkhart-Goshen rose to 9.2% in 2020, 6.0 percentage points above the 2019 unemployment rate. For both MSAs, these are the highest unemployment rates since 2012. The April unemployment rate, after the statewide lockdown order was issued March 23, 2020, reached 21.2% in the South Bend-Mishawaka MSA and 28.6% in the Elkhart-Goshen MSA, which were the highest rates and the largest over-the-month increases in the history of the series (unemployment rate data are available back to January 1990).
Figure 2: Unemployment rate in the South Bend-Mishawaka and Elkhart-Goshen MSAs

Note: Data are shown through August 2020 and are not seasonally adjusted.
Source: STATS Indiana, using Bureau of Labor Statistics data
Employment by industry
The Current Employment Statistics (CES) data (see Table 1) show that the total monthly nonfarm employment in South Bend-Mishawaka declined significantly by 10,888 in 2020, approximately 7.6% lower than that in 2019.4 Employment was down in all major industry sectors, especially with massive job losses in private educational and health services (-2,575 jobs), manufacturing (-2,113 jobs), and leisure and hospitality (-2,025 jobs). Job losses were also witnessed in other services (-913 jobs); trade, transportation and utilities (-900 jobs); professional and business services (-738 jobs); natural resources, mining and construction (-705 jobs); government (-638 jobs); financial activities (-200 jobs); and information (-150 jobs).
Elkhart-Goshen MSA total nonfarm employment was hit hard as well, shedding 11,700 jobs in 2020, which is 8.5% below the 2019 level. Employment decline was led by manufacturing (-8,025 jobs); leisure and hospitality (-1,288 jobs); and trade, transportation and utilities (-1,263 jobs). Employment also declined in government (-325 jobs); private educational and health services (-300 jobs); professional and business services (-163 jobs); other services (-163 jobs); information (-125 jobs); and financial activities (-50 jobs).
Table 1: Year-to-date employment by industry and metro area
| South Bend-Mishawaka | Elkhart-Goshen | |||
|---|---|---|---|---|
| Industry | Employment in 2020 | Change since 2019 | Employment in 2020 | Change since 2019 |
| Total nonfarm | 132,913 | -10,888 | 126,613 | -11,700 |
| Natural resources, mining & construction | 5,238 | -705 | 4,200 | 0 |
| Manufacturing | 15,288 | -2,113 | 58,913 | -8,025 |
| Trade, transportation & utilities | 24,863 | -900 | 18,913 | -1,263 |
| Information | 1,238 | -150 | 275 | -125 |
| Financial activities | 5,500 | -200 | 2,975 | -50 |
| Professional & business services | 13,363 | -738 | 10,163 | -163 |
| Private educational & health services | 34,100 | -2,575 | 12,313 | -300 |
| Leisure & hospitality | 12,850 | -2,025 | 6,500 | -1,288 |
| Other services | 5,963 | -913 | 3,963 | -163 |
| Government (includes public schools & hospitals) | 14,513 | -638 | 8,400 | -325 |
Note: Data are for January through August 2020.
Source: STATS Indiana, using Current Employment Statistics (CES) data from the U.S. Bureau of Labor Statistics
Local wages and hours worked
The cost of labor continued to rise in 2020. Average hourly earnings for all employees on private nonfarm payrolls in 2020 were $24.87 (+2.4%) in South Bend-Mishawaka and $23.96 (+1.5%) in Elkhart-Goshen. The average workweek for all employees extended by 0.7% in South Bend-Mishawaka to 35.19 hours, yet declined by 0.5% to 36.50 hours in Elkhart-Goshen in 2020. Consequently, the average weekly earnings rose by 3.1% to $875 in South Bend-Mishawaka and 0.9% to $874 in Elkhart-Goshen.
Housing
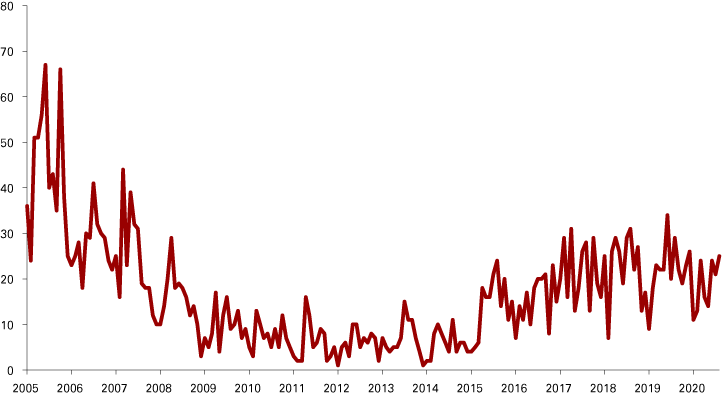
New home construction continued to slow down in St. Joseph County in 2020. Figure 3 displays the single-family residential building permits issued in St. Joseph County from January 2005 to August 2020. The county issued 148 new single-family building permits in the first eight months of 2020. This number was 29 permits fewer and 16.4% lower than that in 2019, which marks a second consecutive year of decline.
Figure 3: Single-family residential building permits in St. Joseph County

Note: Data are shown through August 2020.
Source: St. Joseph County Building Department
Statistics from the Indiana Association of Realtors indicated fewer newly listed houses for sale in St. Joseph County in January-August 2020.5 However, the closed sales remained essentially unchanged, and the median sales price went up 6.9% in 2020, which implied a steadily high demand in the local housing market.
Summary
In the effort to contain the COVID-19 pandemic, Indiana issued a stay-at-home executive order in late March. Consequently, the South Bend-Mishawaka and Elkhart-Goshen MSAs lost 28,157 and 24,173 jobs in April, respectively, according to the household survey. These are the largest single-month employment declines in history dating back to January 1990. The local economy was put to a halt. Since May 2020, with the reopening of local businesses, the economy has been recovering. However, when looking forward to 2021, there is still uncertainty.
The pandemic could have changed consumer attitudes, behaviors and purchasing habits, suggested by recent research from Accenture (April 2020). Consumers are more conscious about their purchases, more likely buying the most basic needs and turning to digital commerce. To cope with isolation, consumers are using digital means to connect, learn and play. For the local economy, the implication is that consumers may continue to exercise caution when attending crowded places such as restaurants, bars, casinos, hotels, movie theaters, department stores, dentists, day care centers, barbers, etc.
This trend is compounded by concerns about the second COVID-19 wave in the fall and winter. At the time of this writing, COVID-19 cases across the nation are rising, with the Midwest leading in new cases per capita. If the outbreak continues, states could reinstate limitations on movement and activities. Altogether, we will see fewer business activities in leisure and hospitality, sensitive retail, personal services, and manufacturing in the first and second quarters of 2021.
In the 2020 recovery, the rebound in consumer spending, to a certain extent, was attributed to massive government stimulus packages. The U.S. government enhanced unemployment benefits to $600 per week (up from $377 per week in the fourth quarter of 2019) and sent pandemic stimulus payments to households under certain income thresholds (Bachman, 2020). However, considering the limited government resources, how long the government stimulus effort can continue will cast a dark cloud over the consumption recovery in 2021.
The presence of effective treatments and vaccines could boost consumer confidence in returning to their pre-pandemic lifestyles. Two vaccines sought authorization from the U.S. Food and Drug Administration in late November 2020. But consumers may still shy away from entertainment, food services and accommodation toward activities that can take place in a socially distanced way while waiting for herd immunity to be reached.
Local government will continue to experience lower tax revenue in 2021 under high unemployment and lower economic activities. Business investment in the affected industries mentioned previously will decline as well due to lower demand. Manufacturing production would slow down if demand remains low.
The housing market is under the impact of mixed factors. The U.S long-term mortgage rate is currently at a very low level.6 Meanwhile, the work-from-home trend is surging. Both factors boost the demand for houses—to take advantage of low interest rates and to improve living conditions. However, the possibility of a double-dip recession, the continued high unemployment rates, and the lack of continued government stimulus will reduce household income in 2021. Based on these mixed effects, St. Joseph County in 2021 will see fewer new home constructions and existing-home sales will soften. The median sales price is still expected to rise, but at a smaller pace.
In summary, as long as the disease remains a significant issue in 2021, consumer demand in leisure and hospitality, sensitive retail and personal services will continue to lag. Softened business investment and a worsened government budget hinder the labor market recovery. In South Bend-Mishawaka, the unemployment rate could be 7-8%, on average. In Elkhart-Goshen, the unemployment rate will be around 6-7%. Personal income in both areas will stay stagnant in 2021.
The lower unemployment rate in the Elkhart-Goshen MSA relative to the South Bend-Mishawaka MSA is attributed to the recreational vehicle (RV) industry rebound, though the manufacturing employment of Elkhart-Goshen in August 2020 is still 8,000 below that in August 2019. According to the RV Industry Association August report, total RV shipments were 39,489 units, up 17.3% from the 33,674 units shipped in August 2019 (even though the cumulative shipments up to August 2020 were still 7.1% below the 2019 level). The spread of the pandemic and the need for social distancing might entice consumers away from using flights and hotels where crowds gather. Instead, the RV is a favorable option to satisfy the desire to travel while keeping a reasonable distance from the public. Consequently, the demand for RVs translates into more production in the RV industry and helps to bring down Elkhart-Goshen's unemployment rate in this forecast.
Notes
- Data on metropolitan GDP for 2020 are not available. The prediction on GDP trends in the South Bend-Mishawaka and Elkhart-Goshen MSAs is based on the industrial electricity usage provided by American Electric Power Company (AEP). According to Narayan et al. (2010), the region’s economy is positively related to its energy use, especially electricity consumption. AEP statistics show that the industrial electricity usage in South Bend-Mishawaka dipped to 237,609 (-22 percent) and 194,674 (-18 percent) (1000 kilowatt hour) in April and May, respectively. Then the electricity usage climbed back up to 313,663 (1000 kilowatt hour) (+61 percent) in June and reached 315,112 (1000 kilowatt hour) in August. Similar trends were observed in the Elkhart-Goshen MSA. The electricity usage was down 14% and 5%, respectively, in April and May and then went up 18% in June and 10% in July. The August 2020 electricity data showed that South Bend-Mishawaka was back to the level consumed in August 2019, but Elkhart-Goshen was still 2.8% below its level consumed one year ago.
- The labor statistics used in the article, including labor force, employment, unemployment, unemployment rate, employment and earnings by industries, are the average of January to August in 2020.
- Labor force and employment data can be accessed on STATS Indiana at www.stats.indiana.edu/laus/laus_view3.html.
- The average monthly nonfarm employment was 132,913 in 2020 for the South Bend-Mishawaka MSA.
- Source: Indiana Housing Market Update, August 2020.
- According to the primary mortgage market survey by Freddic Mac, the U.S. 30-year fixed mortgage rate in the week of October 22 is 2.8 percent, which is the lowest in the past five decades.
References
- Accenture. (2020, April 28). COVID-19: How consumer behavior will be changed. Retrieved from www.accenture.com/us-en/insights/consumer-goods-services/coronavirus-consumer-behavior-research
- Bachman, D. (2020, September 14). United States economic forecast: 3rd quarter 2020. Deloitte Insights. Retrieved from www2.deloitte.com/us/en/insights/economy/us-economic-forecast/united-states-outlook-analysis.html
- Narayan, P., Narayan, S., & Popp, S. (2010). Does electricity consumption panel Granger cause GDP? A new global evidence. Applied Energy. 87: 3294-3298.


