Lafayette Forecast 2011
Economic Research Analyst, Indiana Business Research Center, Kelley School of Business, Indiana University
Associate Editor, Indiana Business Research Center, Kelley School of Business, Indiana University
The year 2009 was characterized by a turbulent economy, and many probably thought 2010 did not feel much better. While the economy improved in 2010, it was still slower than the languid recovery forecasted. Economists continuously downgraded their cautiously optimistic forecasts, consumer confidence declined, and employment figures left something to be desired. As we look to 2011, it appears that the Lafayette Metropolitan Statistical Area (MSA) will continue to recover at a conservative rate. This slow pace of recovery is on par with what’s expected nationally.
Despite the prediction of a modest recovery, the Lafayette MSA, which includes Tippecanoe, Benton and Carroll counties, is still viewed as an attractive area to live and work. After years of strong population growth, the MSA population is expected to rebound in 2011 following the minor drop experienced in 2010 (-0.7 percent), as shown in Figure 1. This population growth has been driven by Tippecanoe County, home to Purdue University and its research park. It is expected that the metro will add about 800 residents in 2011 (a 0.4 percent growth).
Figure 1: Population in the Lafayette MSA, 2000 to 2013
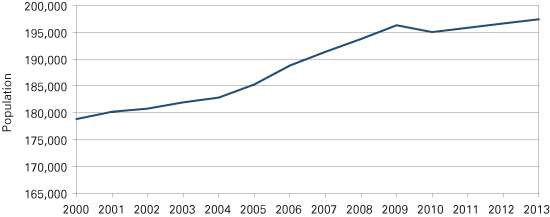
Note: Data for 2010 to 2013 are forecasts.
Source: IBRC, using U.S. Census Bureau data and CEMR forecasts
Labor
As seen in Table 1, except for June and July 2010, the Lafayette MSA consistently performed better than Indiana and the United States in the past year. The uptick in unemployment in June and July 2010 compared to state and national levels mirrors the trend seen in 2009 and may be reflective of the change in the labor force due to students leaving the area during summer break.
Table 1: Unemployment for the Lafayette MSA, Indiana, and the United States, 2009 to 2010
| Year | Month | Lafayette MSA | Indiana | United States |
|---|---|---|---|---|
| 2009 | August | 9.2% | 10% | 9.6% |
| September | 8.9 | 9.5 | 9.5 | |
| October | 8.5 | 9.5 | 9.5 | |
| November | 8.7 | 9.4 | 9.4 | |
| December | 8.8 | 9.7 | 9.7 | |
| Annual | 9 | 10.1 | 9.3 | |
| 2010 | January | 9.6 | 10.5 | 10.6 |
| February | 9.4 | 10.7 | 10.4 | |
| March | 9.4 | 10.7 | 10.2 | |
| April | 8.8 | 9.9 | 9.5 | |
| May | 9.1 | 9.7 | 9.3 | |
| June | 10.2 | 10.2 | 9.6 | |
| July | 9.8 | 10.1 | 9.7 | |
| August | 9.1 | 9.9 | 9.5 | |
| September | 8.5 | 9.5 | 9.2 |
Source: IBRC, using Bureau of Labor Statistics data
Table 2 compares the employment between 2009 and 2010 in the Lafayette MSA. In 2010, the Lafayette MSA continued to shed jobs in nearly every industry. Last year, it was forecasted that the Lafayette MSA would see this shedding of jobs through the second quarter of 2010 before a rebound in hiring occurs. As of September 2010, total nonfarm employment has declined by 2,856 jobs (-3.2 percent) from the 2009 average.
Table 2: Lafayette MSA Employment, 2009 to 2010
| Industry | 2010* | Change since 2009 | Percent Change 2009–2010 |
|---|---|---|---|
| Total Nonfarm | 89,244 | -2,856 | -3.2% |
| Total Private | 61,689 | -1,411 | -2.3% |
| Service-Providing | 73,144 | -1,756 | -2.4% |
| Professional and Business Services | 5,256 | 156 | 3.0% |
| Financial Activities | 3,700 | 0 | 0.0% |
| Private Educational and Health Services | 10,778 | -22 | -0.2% |
| Leisure and Hospitality | 8,644 | -56 | -0.6% |
| Trade, Transportation and Utilities | 13,656 | -144 | -1.1% |
| Other Services | 2,656 | -144 | -5.4% |
| Information | 900 | -100 | -11.1% |
| Government | 27,556 | -1,444 | -5.2% |
| Goods-Producing | 16,100 | -1,200 | -7.5% |
| Manufacturing | 13,378 | -922 | -6.9% |
| Mining, Logging and Construction | 2,722 | -278 | -10.2% |
*January through September average. September data are preliminary. Annual data are used for 2009.
Source: IBRC, using Bureau of Labor Statistics data
The goods production sector continued to take the brunt of the job losses in 2010 (-7.5 percent or 1,200 jobs), with 922 of these job losses occurring in manufacturing. While some manufacturers did rehire laid-off workers or hired additional workers (Wabash National Corporation, Caterpillar and Subaru of Indiana Automotive), it was not enough to offset the additional shedding done by other manufacturers in the area. Manufacturing comprised 15 percent of jobs in the Lafayette MSA in 2010, down from its peak of 21.5 percent in 2000.
Although the service-providing sector was not as severely impacted in 2010, it still saw a 2.4 percent loss in jobs. The information industry experienced the most dramatic decline on a percent basis (-11.1 percent or 100 jobs) since 2009.
In 2011, it is anticipated that all industries will increase their employment in response to an improved economic outlook and increased demand. The strongest growth is expected in the professional and business activities industry, followed by growth in certain manufacturing industries (e.g., motor vehicles and fabricated metals).
Coinciding with the Lafayette MSA’s overall decline in employment in 2009, average weekly wages declined 4 percent from the first quarter of 2009 to the first quarter of 2010. Four out of the 20 major sectors had a wage increase during that time (not adjusted for inflation), as seen in Table 3. In 2011, the average weekly wage and salary earnings may again decline slightly with the addition of new workers at lower pay scales and the approach of a productivity plateau.
Table 3: Average Weekly Wages in the Lafayette MSA, 2009:1 to 2010:1
| Industry | 2010:1 | Percent Change |
|---|---|---|
| Total | $712 | -4.0% |
| Agriculture, Forestry, Fishing and Hunting | 649 | 6.6 |
| Other Services (Except Public Administration) | 456 | 4.8 |
| Accommodation and Food Services | 235 | 4.0 |
| Information | 494 | 0.2 |
| Unallocated | 0 | 0.0 |
| Professional, Scientific, and Technical Services | 877 | -0.6 |
| Retail Trade | 390 | -1.3 |
| Transportation and Warehousing | 689 | -1.9 |
| Administrative and Support and Waste Management and Remediation Services | 421 | -2.1 |
| Educational Services | 955* | -3.2 |
| Real Estate and Rental and Leasing | 524 | -3.7 |
| Public Administration | 706 | -3.7 |
| Health Care and Social Services | 679 | -3.7 |
| Arts, Entertainment, and Recreation | 219* | -3.9 |
| Construction | 698 | -4.3 |
| Manufacturing | 1,089* | -5.6 |
| Finance and Insurance | 876 | -7.4 |
| Wholesale Trade | 860 | -10.0 |
| Management of Companies and Enterprises | 696 | -42.1 |
*These totals exclude county data that are not available due to nondisclosure requirements.
Note: Utilities and mining data are not available due to nondisclosure requirements.
Sources: IBRC, using QCEW data from the Bureau of Labor Statistics
The Lafayette MSA’s per capita personal income (PCPI) continues to lag behind the United States, with the 2009 PCPI only 76.4 percent of the national figure and 85.6 percent of Indiana’s 2009 PCPI; however, the Lafayette MSA is projected to see a 4 percent increase in its PCPI in 2010. The difference between the U.S. and the Lafayette MSA PCPI is likely attributable to the occupational mix in the MSA area and the fact that Indiana’s highest earning tier of occupations tend to be paid less than similar occupations elsewhere, regardless of cost of living factors.1 In 2011, the local PCPI is estimated to increase roughly 3.2 percent.
Housing
Residential construction peaked in 2000 with 1,830 permits issued for single and multi-family building permits in the Lafayette MSA (see Figure 2). Since 2004, there has been a dramatic slowdown in building permits (2006 and 2007 are the exception), ranging from 15 percent to 30 percent a year. January to September data for 2010 indicate that building permit issuances are actually up slightly (8.2 percent) over the 2009 data for the same time period.
Figure 2: Lafayette MSA Residential Building Permits, 1990 to 2010
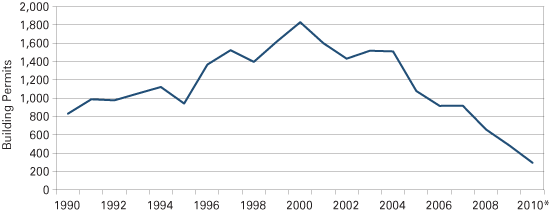
*Reflects year-to-date figures through September 2010
Source: IBRC, using U.S. Census Bureau data
In 2009, 2,049 homes were sold in the Lafayette MSA, down 10.8 percent since 2005. Thirty-three percent of homes sold in the MSA were built in 2000 or later, compared to 23 percent statewide (see Figure 3).
Figure 3: Percent of Homes Sold by Year Built in the Lafayette MSA and Indiana, 2009
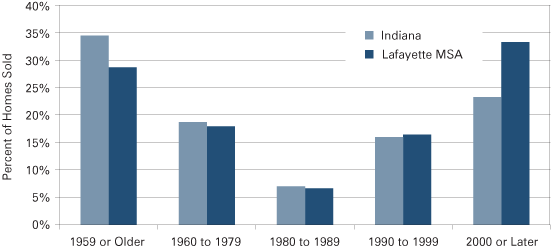
Source: IBRC, using Indiana Association of Realtors data
While Indiana did not experience the housing bubble burst to the extent of states like Florida and California, it was not immune to the overall downhill slide in home prices. The same holds true for the Lafayette MSA. While Indiana saw a decrease in median home values of 9.1 percent from 2005 to 2009, median home values dropped 10.6 percent in Benton County and declined 15.3 percent in Carroll County. However, the median values for Tippecanoe County were unchanged.
A comparison of the January through September figures for 2009 and 2010 finds that the Lafayette MSA real estate market is still relatively soft, as there has been a 0.9 percent decrease in closed sales (see Table 4). All three counties experienced an increase in median sales price, ranging from 0.4 percent in Tippecanoe to 12.8 percent in Carroll County.
Table 4: Lafayette MSA Housing Market, January-September 2009 and 2010
| Lafayette MSA | Benton County | Carroll County | Tippecanoe County | |||||||||
|---|---|---|---|---|---|---|---|---|---|---|---|---|
| 2009 | 2010 | Change | 2009 | 2010 | Change | 2009 | 2010 | Change | 2009 | 2010 | Change | |
| New Listings | 2,766 | 2,815 | 1.8% | 96 | 98 | 2.1% | 278 | 255 | -8.3% | 2,392 | 2,462 | 2.9% |
| Closed Sales | 1,475 | 1,461 | -0.9% | 40 | 50 | 25.0% | 117 | 120 | 2.6% | 1,318 | 1,291 | -2.0% |
| Median Sales Price | n/a | n/a | n/a | $63,000 | $65,500 | 4.0% | $72,250 | $81,500 | 12.8% | $121,500 | $122,000 | 0.4% |
| Months Supply of Inventory | 10.9 | 9.6 | -11.7% | 12.9 | 9.9 | -23.3% | 12.9 | 11.8 | -8.5% | 6.8 | 7.1 | 4.4% |
| Inventory of Homes for Sale | 1,212 | 1,253 | 3.4% | 64 | 53 | -17.2% | 166 | 162 | -2.4% | 982 | 1,038 | 5.7% |
Note: Data for both years show January to September year-to-date.
Source: IBRC, using Indiana Association of Realtors data
In 2011, it is anticipated that home sale prices may increase modestly; however, demand for building permits may be languid despite low mortgage interest rates until the employment situation improves and consumers regain confidence in the economy. In the meantime, it is anticipated that the Lafayette MSA will continue to work off the excess inventory of houses to a more manageable level.
Conclusion
Overall, the Lafayette MSA outlook is expected to show a slight growth in population, employment, PCPI and housing activity, yet experience minor downturns in wages and earnings. The recovery will be modest and dependent on the rate of job growth and consumer confidence in the economy.
Note
- For more research on the differences between U.S. and Indiana PCPI, see Timothy F. Slaper and Ryan A. Krause, “Mix of Occupations Impacts Metro Income,” Indiana Business Review, Summer 2010, www.ibrc.indiana.edu/ibr/2010/summer/article2.html.
Also in this Issue…
- Outlook for 2011
- International Outlook for 2011
- U.S. Outlook for 2011
- Financial Outlook for 2011
- Housing Market Outlook for 2011
- Indiana's Outlook for 2011
- Indiana's Agricultural Outlook for 2011
- Anderson Forecast 2011
- Bloomington Forecast 2011
- Columbus Forecast 2011
- Evansville Forecast 2011
- Fort Wayne Forecast 2011
- Gary Forecast 2011
- Indianapolis-Carmel Forecast 2011
- Kokomo Forecast 2011
- Lafayette Forecast 2011
- Louisville Forecast 2011
- Muncie Forecast 2011
- Richmond Forecast 2011
- South Bend and Elkhart Area Forecast 2011
- Terre Haute Forecast 2011