Gary Forecast 2011
Associate Professor of Economics, School of Business and Economics, Indiana University Northwest
The Business Cycle Dating Committee of the National Bureau of Economic Research has determined that the current recession began in December 2007 and that the recovery began in June 2009.1 There is widespread agreement that this has been the worst recession the U.S. economy has experienced since World War II, and the dimensions of the decline are striking. Between December 2007 and June 2009, employment in the United States declined by 5.3 percent, with a net loss of about 7.3 million jobs, and the unemployment rate rose from 5.0 percent to 9.5 percent.2 U.S. gross domestic product (GDP) declined during this period (fourth quarter 2007 to second quarter 2009) by 4.1 percent (using chained dollars).
In northwest Indiana, employment fell 7.2 percent, a net loss of 20,800 jobs, as the unemployment rate rose from 4.6 percent to 10.6 percent. GDP data are not readily available for the local economy, but total wages paid to employees in the broader northwest Indiana region fell by 15.2 percent between the fourth quarter of 2007 and the second quarter of 2009.3 It is clear that the recession hit northwest Indiana harder than it hit the nation.
Since the recovery began in June 2009, employment nationally has actually declined slightly (-0.25 percent), while the unemployment rate has increased to 9.6 percent (from 9.5 percent). Nationally, GDP has increased by 3 percent (through the second quarter of 2010). Growth in GDP during the early stages of this recovery has been disappointing, but is comparable to growth coming out of the 1991 and 2001 recessions.
Local employment in northwest Indiana has actually grown in recent months, rising by 1.3 percent between July 2009 and September 2010; as with the nation, however, this has not led to a decline in the unemployment rate, which is essentially unchanged (10.6 percent compared to 10.5 percent). Total wages in the first quarter of 2010 (the most recent data available) for the broader northwest Indiana region have continued to decline, down by 2.8 percent since the second quarter of 2009.
The last three years have been perhaps the most difficult period the U.S. economy has encountered since World War II, so the question is, “what we can expect going forward?”
The baseline sub-state forecasts from the Center for Econometric Model Research forecasts employment growth in northwest Indiana of about 1.3 percent for 2011, 1.7 percent for 2012, and 1.5 percent for 2013. If this occurs, it will match the fastest three-year growth in employment that northwest Indiana has experienced since 1990, which occurred between 1995 and 1999, during the boom years of the second Clinton administration. Three-year growth in employment coming out of the 1991 recession averaged about 0.5 percent per year, and employment actually fell during the first three years following the end of the 2001 recession. My expectation is that growth in employment in northwest Indiana will do what it has usually done over the past 20 years—underperform both the state and the nation. Income growth is likely to be slower as well.
Employment and Income Growth
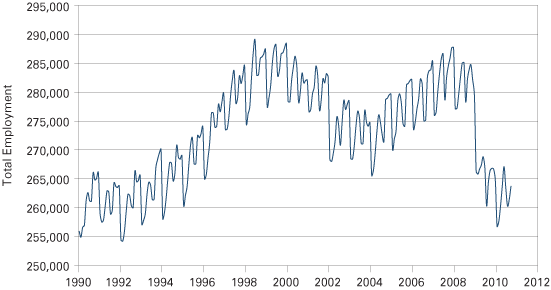
Coming into the recovery phase of the current business cycle, total employment is at about the same level as it was in 1995 (see Figure 1). By contrast, national employment is at roughly its 2004 level. So both locally and nationally, there is considerable opportunity for employment growth. The extent of employment growth will depend on growth in the economy, and here is where the problem would seem to lie. According to Reuters, the consensus forecast for U.S. GDP growth in 2011 is 2.7 percent.4 This remains below the long-term rate of growth of GDP, which is about 3.2 percent per year from 1947 through 2010.
Figure 1: Total Employment in Northwest Indiana, 1990 to September 2010

Source: IBRC, using Bureau of Labor Statistics data
Since 1947, the average annual rate of growth in labor productivity has been 2.3 percent per year. If output grows at a rate of 2.7 percent per year, we would expect employment growth of about 0.4 percent, which may not be enough even to reduce the national unemployment rate.5 If we accept the consensus forecast about GDP growth, however, then we are almost forced to expect national employment growth of something around 0.4 percent unless productivity growth collapses. And, on average, productivity growth in the recovery phase of the business cycle since World War II has averaged about 2.4 percent, or almost the same as average productivity growth during the postwar period. So it seems reasonable to expect employment growth for the near-term future of around 0.4 percent per year nationally.
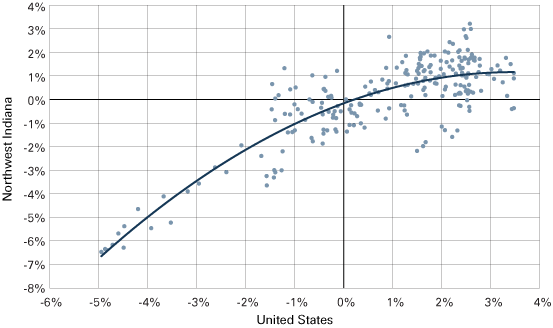
In addition, there is a fairly consistent relationship between employment growth nationally and employment growth in northwest Indiana, as seen in Figure 2. Unless national growth is stronger than the consensus forecast, or unless productivity growth is slower than history would lead us to believe, employment in northwest Indiana is likely to grow by about 0.2 percent. Employment at the end of 2010 seems likely to end up being about 263,600. Using employment growth of 0.2 percent for 2011, total employment should rise to end 2011 at about 264,400, or roughly 500 jobs ahead of the end of 2010.
Figure 2: Annualized Growth of Monthly Employment in Northwest Indiana and the United States, 1990 to 2010

Source: IBRC, using Bureau of Labor Statistics data
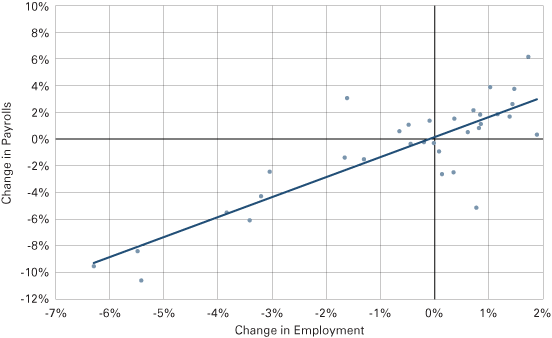
Just as there is a fairly consistent relationship between national and regional employment growth, there is also a fairly consistent relationship between growth in payrolls (adjusted for inflation) and growth in employment (see Figure 3).
Figure 3: Employment Growth and Growth in Total Real Wage Payments in the Broader Northwest Indiana Region, 2001:1 to 2010:1

Source: IBRC, using Bureau of Labor Statistics data
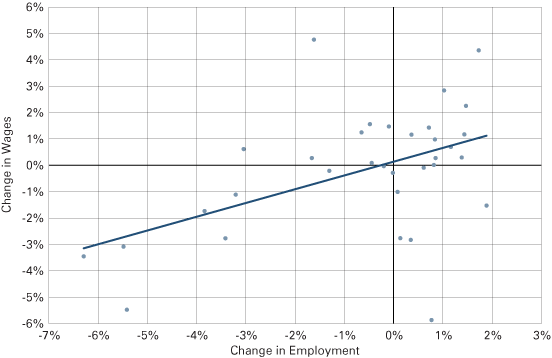
Given the 0.2 percent increase in employment we expect, we would also expect real payrolls to rise by about 0.36 percent. Real weekly wage payments should rise by about 0.2 percent (see the relationship in Figure 4), from about $710 per week to about $712 per week. As is the case with the increase in employment, the increases in income are extremely small.
Figure 4: Growth in Employment and the Change in Real Weekly Wages in the Broader Northwest Indiana Region, 2001:1 to 2010:1

Source: IBRC, using Bureau of Labor Statistics data
Sectoral Differences: Cases for Optimism?
Growth, of course, will differ significantly by sector (see Table 1). We anticipate that there will be some recovery in construction, with employment rising by 2.8 percent, or some 400 jobs. Given the extraordinary decline in construction activity (which really hit northwest Indiana in late 2008; employment has declined by 31.5 percent from October 2008 to September 2010), this growth will still leave construction activity well below its capacity. Health care should continue its historically strong growth, adding about 1,000 jobs (or 2.7 percent growth). Both the entertainment sector (arts, entertainment and recreation) and the hotel/food service sector (accommodation and food services) will add a significant number of jobs (about 280 and 300, respectively, or growth of 3.8 percent and 1.3 percent).
Table 1: Employment Forecast for Selected Sectors in Northwest Indiana, 2010 to 2011
| Industry | Change in Number of Jobs | Percent Change |
|---|---|---|
| Construction | 410 | 2.8% |
| Health Care and Social Assistance | 1,050 | 2.7% |
| Arts, Entertainment and Recreation | 280 | 3.8% |
| Accommodation and Food Services | 300 | 1.3% |
| Manufacturing | -900 | -2.3% |
| Iron and Steel Mills | -530 | -3.5% |
Source: Based on author’s calculations.
Government will not be a significant contributor to growth in the coming year. Aside from the pressure that is growing to reduce the federal government’s budget deficit, federal government employment is fairly modest in northwest Indiana (and we expect a modest decline in it). The state and many local governments are also under considerable pressure to reduce their spending levels in order to meet the mandate in the Indiana Constitution to have balanced budgets. Thus, we expect only slight growth in state or local employment, with almost all of that concentrated in local public education. Overall, we expect government employment to grow by roughly 0.2 percent, about the same as overall employment.
Major job losses are likely to continue in manufacturing. We expect the loss of around 900 manufacturing jobs (-2.3 percent), with most of that in the iron and steel mill sector (a loss of 530 jobs, or -3.5 percent.).
Other sectors seem likely to shed jobs as well, although in smaller numbers (and as a smaller percentage of employment). Job losses seem likely in the utilities, transportation and warehousing; finance; and real estate sectors.
Concluding Remarks
The recession hit northwest Indiana severely. Not only were job losses large, they were concentrated in the highest wage sectors of the economy (construction, manufacturing and finance). We expect growth in only one of these hard-hit sectors over the next year, and construction will remain severely below its potential.
Unless national economic growth is substantially more robust than expected, there is little reason to expect much upside to our forecast. The northwest Indiana economy will do better than it has done in 2009 or 2010, but the coming year will not bring a boom. What lies ahead is likely to be less unpleasant times, rather than a robust recovery.
Notes
- See www.nber.org/cycles/cyclesmain.html.
- Here we are looking at payroll employment, defined as the number of paid employees at business firms. This is different from household employment, which is measured by the Current Population Survey and is used, among other things, in the determination of the unemployment rate. Unless otherwise noted, all data for the United States come from either the Bureau of Labor Statistics or the Bureau of Economic Analysis website. All data for northwest Indiana can be found at STATS Indiana.
- This article defines northwest Indiana as the four-county Gary Metropolitan Division. The broader northwest Indiana region includes seven counties: Jasper, Lake, LaPorte, Newton, Porter, Pulaski, and Starke.
- “Economists Cut U.S. Growth Forecast Again,” Reuters, September 6, 2010, www.reuters.com/article/idUSTRE6880KI20100909.
- According to Reuters, the consensus forecast for the U.S. unemployment rate by the end of 2011 is 9 percent.
Also in this Issue…
- Outlook for 2011
- International Outlook for 2011
- U.S. Outlook for 2011
- Financial Outlook for 2011
- Housing Market Outlook for 2011
- Indiana's Outlook for 2011
- Indiana's Agricultural Outlook for 2011
- Anderson Forecast 2011
- Bloomington Forecast 2011
- Columbus Forecast 2011
- Evansville Forecast 2011
- Fort Wayne Forecast 2011
- Gary Forecast 2011
- Indianapolis-Carmel Forecast 2011
- Kokomo Forecast 2011
- Lafayette Forecast 2011
- Louisville Forecast 2011
- Muncie Forecast 2011
- Richmond Forecast 2011
- South Bend and Elkhart Area Forecast 2011
- Terre Haute Forecast 2011


