Housing Market Outlook for 2011
Economic Research Analyst, Indiana Business Research Center, Kelley School of Business, Indiana University Bloomington
The short-term direction of the housing market seems as murky today as it has at any point in recent years. Following the expiration of the federal homebuyer tax credit program in June, housing demand has been lackluster, even by today’s standards. Additionally, mounting foreclosures and short sales threaten to erode home values further. Meanwhile, the stalled labor market serves as a backdrop to these housing woes. Daunting as these problems may be, the conditions are right for a recovery as prices have come down and interest rates are low. However, it may be some time before consumers are confident enough to jump back into the housing market in large numbers.
Housing Market Tries to Stand on Its Own
The dramatic decline in the U.S. housing market in recent years has been well documented. The sale of new homes dropped 71 percent from a peak of about 1.4 million units in 2005 to 374,000 units in 2009. Existing single-family home sales fell 27 percent over the same period and home values have declined in much of the country. In response to these conditions, the federal government initiated its tax credit program for homebuyers in hopes of boosting demand. It seems clear that this program, which ran from early 2009 through April 2010, did at least help to break the free fall in home sales and values. However, it is difficult to know if these tax credits simply hastened the purchase of homes by those who would have bought anyway or if they induced new buyers into the market.
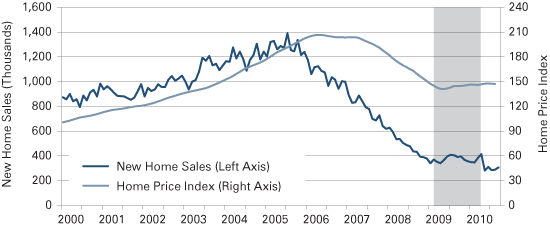
Whichever the case may be, Figure 1 suggests that we are in the midst of a predictable post-homebuyer-tax-credit hangover. After declining at an average rate of 3.1 percent per month between July 2005 and April 2009, new home sales stabilized and grew at an average monthly rate of 1.1 percent through April 2010. Without the aid of federal stimulus, however, new home sales fell sharply in May 2010 and have remained low. In fact, the five months since the expiration of the tax credits are the five lowest monthly new homes sales figures on record dating back to 1963. Home values, as measured by the Case-Shiller Home Price Index, also steadied while the tax credits were active but ticked downward in July and August.
Figure 1: New Home Sales and Case-Shiller 20-City Home Price Index, 2000 to September 2010

Note: The shaded area indicates the period that federal home buyer tax credits were available. Both variables are seasonally adjusted. New home sales are reported as an annual rate. Hash marks indicate January and July of each year.
Source: IBRC, using Standard & Poor’s and U.S. Census Bureau data
The situation has been similar in the market for existing homes. According to the National Association of Realtors, existing home sales increased nearly 5 percent between 2008 and 2009 and the rate of sales remained relatively strong through the first half of 2010. The expiration of the tax credits, though, triggered a 27 percent drop in the seasonally adjusted rate of existing home sales between June and July.1 In contrast to new home sales, the existing home market has bounced back more sharply with the September sales figure up 18 percent over the July mark.
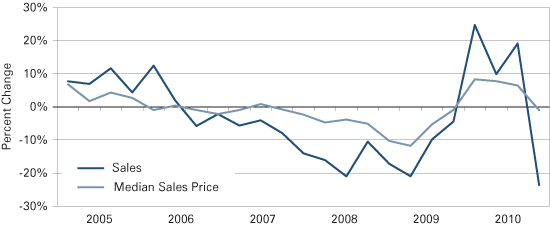
Much of this instability has been driven by troubles in the once booming housing markets of the South and West. States like Florida, Nevada, Arizona and California have headlined this crisis. Yet the Indiana housing market has experienced similar trends. As Figure 2 shows, both median home prices and sales declined year-over-year for most quarters between 2005 and the early 2009, but these measures rebounded over the next year and a half. However, the demand pulled forward by the tax credits left Indiana with a 24 percent year-over-year decline in sales in the third quarter of 2010 and a 1 percent decline in the median sales price.
Figure 2: Year-over-Year Change in Indiana Home Sales and Median Price, 2005:1 to 2010:3

Note: Hash marks indicate quarters of each year.
Source: IBRC, using Indiana Association of Realtors data
Foreclosure Problems Persist
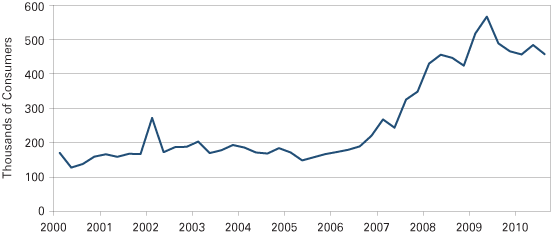
One major force that continues to place downward pressure on home values is the continued foreclosure crisis. Figure 3 indicates that the quarterly flow of individuals with new foreclosures has improved from peak levels recorded in 2009 but continues to be elevated. In contrast to the slight decline seen in new foreclosures in the third quarter, the New York Fed also reports that the share of mortgages that transitioned into delinquency increased for the first time since 2009. An uptick in delinquencies could signal another rise in foreclosures.
Figure 3: Number of U.S. Consumers with New Foreclosures, 2000:1 to 2010:3

Source: IBRC, using Federal Reserve Bank of New York data
Compounding this problem is the recent revelation of improper documentation for many properties in foreclosure. Efforts to remedy the so-called “robo-signing” practices could lengthen the time it takes to clear foreclosed properties from the market, which would act as a further drag on the housing recovery.
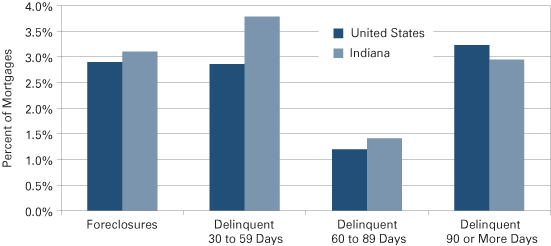
The foreclosure crisis has hit Indiana harder than the United States as a whole. Figure 4 shows that the share of Indiana’s prime mortgages in foreclosure in August 2010 is slightly higher than the U.S. average. Perhaps more alarming is the share of the state’s prime mortgages in the early stages of delinquency. The pattern is similar for mortgages owned by Fannie Mae and Freddie Mac, with 8.4 percent of Indiana’s mortgages held by these entities either delinquent or in foreclosure compared to 7.3 percent nationally. Indiana’s above average mortgage delinquency situation should come as no surprise given that the state has had one of the nation’s highest unemployment rates in recent months.
Figure 4: Percent of Prime Mortgages in Foreclosure or in a Stage of Delinquency in Indiana and the United States, August 2010

Source: IBRC, using Federal Reserve Bank of New York data
Home Construction
The trends in residential building permits and housing starts largely mirror what we saw in new home sales. Each indicator stabilized in 2009 and 2010 but neither has risen appreciably. While it is welcome news that these indicators have steadied, they have settled at levels that are roughly one quarter of 2005’s peak of construction activity. In 2009, Indiana recorded its lowest level of residential building permits since 1982.
Conclusion
The housing markets in the U.S. and in Indiana will likely see growth in 2011, but with the broader economy, this growth will be modest. As Table 1 outlines, two industry trade groups forecast that housing starts and home sales will climb somewhat but, in the case of home sales, the numbers are not likely to reach the level seen prior to the tax credit deadline. While there is currently some slack in demand, reduced prices and low interest rates should keep home purchases attractive. The housing market is now simply waiting on a robust economic recovery to spur consumers into taking advantage of very favorable affordability conditions. Unfortunately, that strong recovery appears to be at least a year or two away.
Table 1: National Association of Realtors (NAR) and Mortgage Bankers Association (MBA) Forecasts, 2010:2 to 2011:4
| Housing Starts (SAAR, thousands) | Existing Home Sales (SAAR, thousands) | 30-Year Fixed Rate Mortgage | Median Existing Home Price (Thousands) | |||||
|---|---|---|---|---|---|---|---|---|
| NAR | MBA | NAR | MBA | NAR | MBA | NAR | MBA | |
| 2010:2 | 602 | 602 | 5,570 | 5,570 | 4.9% | 4.9% | $176.6 | $176.6 |
| 2010:3 | 594 | 589 | 4,150 | 4,026 | 4.5 | 4.6 | 177.6 | 161.0 |
| 2010:4 | 653 | 580 | 4,531 | 4,232 | 4.5 | 4.4 | 168.6 | 163.6 |
| 2011:1 | 698 | 595 | 4,765 | 4,650 | 4.7 | 4.7 | 165.9 | 170.1 |
| 2011:2 | 746 | 635 | 5,202 | 4,701 | 4.9 | 4.8 | 177.0 | 169.9 |
| 2011:3 | 791 | 670 | 5,391 | 4,900 | 5.1 | 5.0 | 179.2 | 171.4 |
| 2011:4 | 843 | 735 | 5,188 | 5,051 | 5.4 | 5.1 | 170.4 | 173.5 |
Notes: Actual values are reported for 2010:2. Figures were taken from each organization’s October 2010 forecasts.
Source: National Association of Realtors and Mortgage Bankers Association
Note
- The data sources for new and existing homes show that each market responded to the expiration of the tax credit at different times. This discrepancy is due to how home sales are counted. New home sales are counted when a sales contract is signed while existing home sales are counted when the sales contract is closed.
Also in this Issue…
- Outlook for 2011
- International Outlook for 2011
- U.S. Outlook for 2011
- Financial Outlook for 2011
- Housing Market Outlook for 2011
- Indiana's Outlook for 2011
- Indiana's Agricultural Outlook for 2011
- Anderson Forecast 2011
- Bloomington Forecast 2011
- Columbus Forecast 2011
- Evansville Forecast 2011
- Fort Wayne Forecast 2011
- Gary Forecast 2011
- Indianapolis-Carmel Forecast 2011
- Kokomo Forecast 2011
- Lafayette Forecast 2011
- Louisville Forecast 2011
- Muncie Forecast 2011
- Richmond Forecast 2011
- South Bend and Elkhart Area Forecast 2011
- Terre Haute Forecast 2011


