Bloomington forecast 2017
Director, Indiana Business Research Center, Indiana University Kelley School of Business
The performance of the Bloomington-area economy reveals a pattern of growth mixed with challenges. Summarized below is our analysis of local area performance across a variety of measures and our forecast for 2017.
Local economy growing gradually
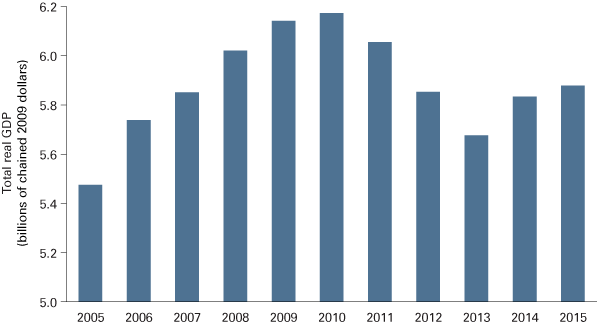
The Bloomington Metropolitan Statistical Area (MSA) economy, consisting of Monroe and Owen counties, expanded in 2015 for a second straight year, though by less than 1 percent (about $44 million in real-GDP terms).1 This upturn follows three years of local post-recession shrinkage (see Figure 1). Despite the recent growth, however, the local economy is still $295 million smaller than it was in 2010.
Figure 1: Bloomington MSA economy starting rebound

Source: IBRC, using U.S. Bureau of Economic Analysis data
Given Bloomington’s weak GDP growth coupled with its continued population growth, the metro area’s real GDP per capita was essentially flat in 2015 at $35,501—just two-thirds of the national per capita GDP and more than $3,400 below Bloomington’s 2009 peak (which was 78 percent of the U.S. metro average). In contrast, the nation’s combined metropolitan economies grew by an average of 6.2 percent since 2009. Over the 2005-2015 period, GDP per capita in the nation’s metro areas averaged 13.1 percent growth, well above the 7.4 percent gain in the Bloomington area. Thus, the Bloomington economy is falling farther behind the average metro area.
Manufacturing remained the largest contributor to the area’s economy last year, generating 22.7 percent of total GDP, although the sector’s output shrank slightly from the year before. Government was close behind at 22.4 percent; these two sectors combined account for nearly half of the local economy—more than $2.6 billion.
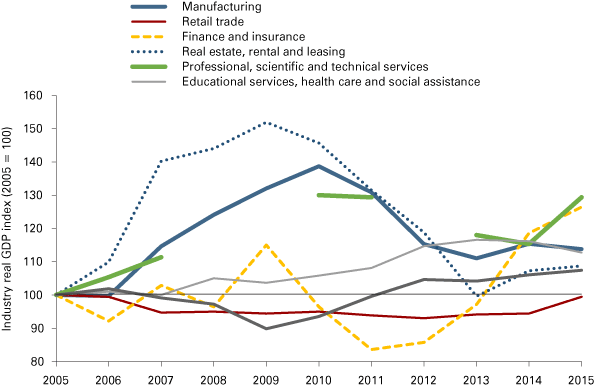
Trends in several sectors over the past decade are shown in Figure 2. The biggest swings across these years are seen in the real estate, rental and leasing industry, which grew more than 50 percent from 2005 to 2009—only to drop to the 2005 level again by 2013. Since then, the sector has grown slowly. Manufacturing experienced similar swings in local output, peaking in 2010 (nearly 40 percent above its 2005 level), only to surrender most of that gain by 2013. The two subsequent years have witnessed only slight growth in local manufacturing output.
Figure 2: Bloomington MSA output by industry: GDP relative to 2005

Note: Data for professional, scientific and technical services is not available for all years.
Source: IBRC, using U.S. Bureau of Economic Analysis data
The education, health care and social services sector has grown gradually through most of the decade, with a mild retreat in the past two years. In contrast, the finance and insurance industry has had the most volatile ride over the past 10 years, finally starting a period of impressive output growth in 2012 that reached 26 percent above the industry’s 2005 output. Perhaps least volatile of the main local sectors has been retail trade, whose output slowly moved down and then up within a 7 percent range across the decade, ending 2015 about where it was 10 years earlier.
Employment steady, unemployment shrinking
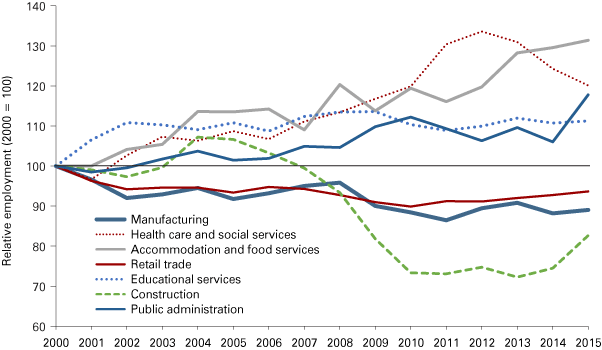
The Bloomington metro area has experienced very limited job growth for many years. Total payroll employment last year averaged just 2,655 jobs (4 percent) more than at the start of the century. This aggregate change, however, obscures substantial variation across industries. For instance, as seen in Figure 3, the health care and social services sector had expanded by one-third as of 2012, though it’s slipped a bit since; in 2015, there were still 20 percent more jobs in the sector than in 2000. The highest-growth large sector has been accommodation and food services, with 31 percent job growth since 2000; public administration has also grown steadily by 18 percent. The other large sector with significant growth (11 percent) is educational services, though most of its growth was achieved by 2002.
Figure 3: Relative change in Bloomington MSA employment: Seven largest industries

Source: IBRC, using Quarterly Census of Employment and Wages (QCEW) data from the U.S. Bureau of Labor Statistics
Several large sectors shed jobs over this period. Among the largest are manufacturing (down 1,059 jobs since 2000), construction (down 509 jobs since 2000, but growing again the last few years), and retail (down 507 jobs since 2000).
The Bloomington MSA unemployment rate has declined steadily since peaking at 9.2 percent in 2010 (not seasonally adjusted). The rate stood at 4.3 percent in September 2016, and it’s stayed under 6 percent for more than two years. This rate represents 2,926 people looking for work, compared to more than 4,000 as recently as 2014 and more than 6,000 in 2010.
Average weekly wages for payroll workers in the Bloomington MSA reached $779 last year, 5.6 percent higher than the year before and a 14 percent gain since 2000 (adjusted for inflation). This was the area’s fastest year-over-year wage growth in at least 15 years.
Personal income growth accelerating
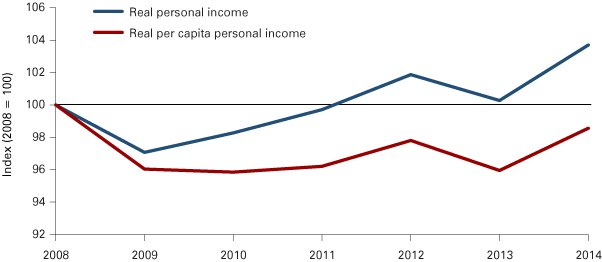
The latest revised real personal income (PI) data at the time of this writing show Bloomington metro area residents’ real personal income rising in 2014 by 3.4 percent to $5.36 billion, an all-time high, improving on the modest growth characterizing most of the years following the Great Recession. Since the area’s population continues growing faster than its PI, its real per capita personal income (PCPI) grew just 2.7 percent in 2014, less robustly than total PI growth (see Figure 4). At $32,647, the area’s PCPI was far below the state and national averages of $40,640 and $42,523, respectively, reflecting the notable impact tens of thousands of students have on the local average.
Figure 4: Real personal income and per capita income in the Bloomington MSA

Source: IBRC, using U.S. Bureau of Economic Analysis data
Stronger housing market
Monroe County year-to-date closed home sales through October 2016 were 10 percent above 2015’s pace, a solid growth rate. Median sale prices for the same period rose 2 percent, and the inventory of homes on the market in October was down 16 percent versus a year earlier. The latter trend resulted in not quite enough supply of homes to meet five months’ demand. This tightening supply implies a continued rise in home prices in the year ahead.
Far fewer residential building permits were issued in Monroe County in 2015 than in each of the three previous years. And for the first time in four years, more single-family permits were issued than multi-family permits. The area’s multi-year stretch of building large apartment complexes may finally have satisfied demand.
The year ahead
The IBRC’s Center for Econometric Model Research forecasts 2017 employment growth of about 2.1 percent (2,300 jobs) for the Bloomington metro area and personal income growth around 4.2 percent (around $300 million). Such outcomes would be the strongest in several years, ranking Bloomington in the top few Indiana metropolitan areas.


