
Lafayette forecast 2017
Community Development Regional Extension Educator, Purdue University
The Lafayette Metropolitan Statistical Area (MSA) returned to its tortoise pace on our less-than-robust economic recovery from the Great Recession. In 2016, the manufacturing and mining/logging/construction industries were the source of employment growth, serving as a contributing factor to dropping unemployment rates, increased employment and increased wages in the area.
The Lafayette MSA (which includes Tippecanoe, Benton and Carroll counties) has rebounded from that recession in a sustainable fashion with slow and steady growth—albeit frustratingly slow at times. Looking toward the future, there is little doubt that growth will continue, thanks to its diverse industry portfolio and strong university connection. These strengths coupled with its geographic location make it an attractive area to live and work.
The MSA has experienced continuous population growth—an addition of approximately 2,600 people per year between 2005 and 2015 (see Figure 1). The 2015 population is 214,363, and the Indiana University Center for Econometric Model Research anticipates annual population growth of 0.8 percent in the region through 2019.
Figure 1: Annual Lafayette MSA Population
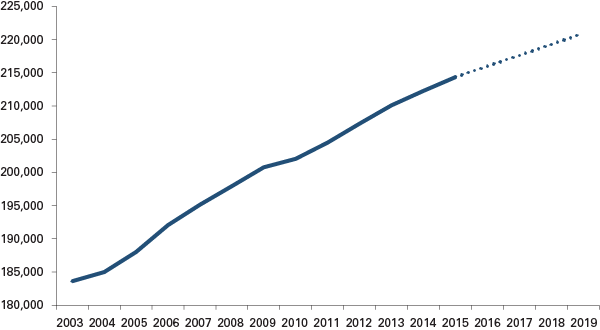
Note: Data for 2016 through 2019 are projections.
Source: U.S. Census Bureau and Indiana University Center for Econometric Model Research
Labor
The Lafayette MSA maintained a lower unemployment rate than the United States between August 2015 and September 2016 (see Table 1). The MSA also maintained lower unemployment rates relative to the state as a whole, except in March and July 2016. These lower unemployment rates reflect the diverse and strong economy within the Lafayette MSA. Last year’s outlook predicted the MSA would see upper 3 percent unemployment rates, and that did occur a few times. In 2017, the local unemployment rate should continue to range between 3.5 and 4.5 percent due to steady economic growth.
A year-over-year comparison between September 2015 and 2016 shows that employment increased by 4,172 workers.
Table 1: Labor force and unemployment for the Lafayette MSA
| Year | Month | Labor force | Employment | Unemployed | Lafayette MSA unemployment rate | Indiana unemployment rate | U.S. unemployment rate |
|---|---|---|---|---|---|---|---|
| 2015 | August | 103,998 | 99,690 | 4,308 | 4.1% | 4.5% | 5.2% |
| September | 108,558 | 104,612 | 3,946 | 3.6% | 4.1% | 4.9% | |
| October | 109,632 | 105,491 | 4,141 | 3.8% | 4.3% | 4.8% | |
| November | 109,951 | 105,418 | 4,533 | 4.1% | 4.5% | 4.8% | |
| December | 108,881 | 104,546 | 4,335 | 4.0% | 4.5% | 4.8% | |
| Annual | 107,381 | 102,864 | 4,517 | 4.2% | 4.8% | 5.3% | |
| 2016 | January | 109,205 | 104,380 | 4,825 | 4.4% | 5.1% | 5.3% |
| February | 111,077 | 105,925 | 5,152 | 4.6% | 5.4% | 5.2% | |
| March | 110,869 | 105,597 | 5,272 | 4.8% | 4.4% | 5.1% | |
| April | 112,578 | 107,929 | 4,649 | 4.1% | 4.8% | 4.7% | |
| May | 111,386 | 107,137 | 4,249 | 3.8% | 4.3% | 4.5% | |
| June | 108,620 | 103,714 | 4,906 | 4.5% | 4.6% | 5.1% | |
| July | 109,447 | 104,465 | 4,982 | 4.6% | 4.4% | 5.1% | |
| August | 109,490 | 104,720 | 4,770 | 4.4% | 4.6% | 5.0% | |
| September* | 112,961 | 108,784 | 4,177 | 3.7% | 4.2% | 4.8% |
*Preliminary data
Source: U.S. Bureau of Labor Statistics
Table 2 looks specifically at regional employment between 2015 and 2016 in the Lafayette MSA. Last year, it was anticipated that most of the employment growth would stem from professional and business services, with the potential for pullback in the manufacturing industry. However, though the MSA has had an increase in jobs thus far in 2016 (756 employees, or 0.7 percent), much of the gain came from goods-producing industries—manufacturing and mining/logging/construction industries (+533 workers). Professional and business services had the largest industry decline in numeric terms (-117 employees). Other industries with employment declines were also in the service-providing industries (information; other services; and trade, transportation and utilities), as well as government.
Table 2: Lafayette MSA employment
| Industry | 2016* | Change since 2015 | Percent change, 2015-2016 |
|---|---|---|---|
| Total nonfarm | 101,822 | 756 | 0.7% |
| Total private | 73,367 | 850 | 1.2% |
| Goods-producing | 21,467 | 533 | 2.5% |
| Manufacturing | 17,789 | 256 | 1.5% |
| Mining, logging and construction | 3,678 | 278 | 8.2% |
| Service-providing | 80,356 | 222 | 0.3% |
| Private educational and health services | 12,167 | 350 | 3.0% |
| Trade, transportation and utilities | 14,722 | -19 | -0.1% |
| Leisure and hospitality | 9,556 | 131 | 1.4% |
| Professional and business services | 7,567 | -117 | -1.5% |
| Financial activities | 3,633 | 33 | 0.9% |
| Information | 778 | -22 | -2.8% |
| Other services | 3,478 | -39 | -1.1% |
| Government | 28,456 | -94 | -0.3% |
*January through September data annualized for 2016. September data are preliminary.
Source: U.S. Bureau of Labor Statistics
As of September 2016, the top three industries in the Lafayette MSA are manufacturing (18 percent), trade, transportation and utilities (15 percent) and private educational and health services (12 percent). These top industries are reflective of the many manufacturing firms and their corresponding transportation providers, as well as the strength and presence of numerous health care facilities.1
Since last year, the economic data show the economy’s growth is derived from household spending. Economic news from the Lafayette MSA has been much quieter than typical, with a few layoff announcements (Oerlikon Fairfield and ALCOA). One must not forget that in recent years, several larger firms announced expansion plans that were not to be completed until 2016. While large job announcements have been less prevalent in 2016, several stories have emerged talking about the Lafayette MSA’s budding technology sector—giving an insight into other oft-overlooked sectors that are positively churning.
In 2017, slow and steady growth is expected to occur, a continuation of the trend since the recession. It is projected the Lafayette MSA may gain an additional 2,800 workers, distributed throughout the various industries. Recognizing that much of the economic growth has been occurring in household expenditures, the manufacturing sector is not expected to perform strongly. Rather, much of the growth will likely occur in other industries.
Between the first quarters of 2015 and 2016, average weekly wages increased 0.8 percent within the Lafayette MSA, considerably less than experienced between the first quarters of 2014 and 2015 (which yielded 4.6 percent growth). Eleven out of the 18 major sectors (two were nondisclosed) had negative wage increases, ranging from -0.7 percent (information) to -9.2 percent (management of companies and enterprises), as seen in Table 3. This negative growth pulled down the positive wage increases among the remaining industries (construction saw 14 percent growth and educational services had 9 percent growth). A similar level of wage growth is expected for 2017.
Table 3: Average weekly wages in the Lafayette MSA
| Industry | Average weekly wage, 2016 Q1 |
Change in jobs since 2015 Q1 |
Change in average weekly wage since 2015 Q1 |
|---|---|---|---|
| Total | $853 | 0.2% | 0.8% |
| Management of companies and enterprises | $1,288 | 2.1% | -9.2% |
| Manufacturing* | $1,341 | 1.3% | -5.2% |
| Professional, scientific, and technical services | $1,132 | -1.9% | 5.5% |
| Wholesale trade | $1,081 | -0.8% | 0.7% |
| Educational services* | $1,085 | -0.3% | 9.0% |
| Finance and insurance | $1,099 | -7.0% | -6.2% |
| Construction | $912 | 6.2% | 14.1% |
| Health care and social services | $804 | 3.0% | -3.4% |
| Transportation and warehousing | $767 | -3.0% | -4.8% |
| Public administration | $760 | 1.7% | -2.4% |
| Agriculture, forestry, fishing and hunting | $719 | 2.4% | -3.5% |
| Real estate and rental and leasing | $635 | 9.3% | 1.1% |
| Information | $714 | 1.1% | -0.7% |
| Other services (except public administration) | $565 | 4.3% | -2.6% |
| Retail trade | $446 | 0.3% | -1.1% |
| Administrative and support and waste management and remediation services | $485 | -17.2% | 8.5% |
| Accommodation and food services | $284 | 5.7% | 4.4% |
| Arts, entertainment, and recreation | $229 | 11.1% | -8.0% |
* Indicates that some county-level data were excluded due to confidentiality restrictions.
Note: Data for mining and utilities were nondisclosable.
Source: STATS Indiana, using Quarterly Census of Employment and Wages data
Research shows that per capita personal income (PCPI) in Indiana and the Lafayette MSA historically lags behind the United States, due to a different occupational mix within the MSA and the fact that Indiana’s highest-earning occupations tend to be paid less than similar occupations elsewhere, regardless of cost of living factors.2 The most recent data for the Lafayette MSA at the time of this writing was 2014, which showed the MSA’s PCPI being 74 percent of the national figure. Growth in the Lafayette MSA’s PCPI between 2013 and 2014 was 2.6 percent. In 2015 and beyond, it is projected that PCPI will increase by more than 3 percent annually.
Housing
The real estate market in the Lafayette MSA continues to tighten slightly, with an uptick in closed sales (4.9 percent) and a drop in new listings (-2.9 percent). Table 4 outlines the comparison of year-to-date (January through September) 2016 figures with 2015. Among the three counties that make up the Lafayette MSA, two experienced higher median sales price values, with Carroll County being the exception (-4.1 percent).
Across the three counties, each has a different housing story, with Tippecanoe County seeing an uptick in closed sales and median sales price and a drop in new listings. The months supply of housing inventory for the county has dropped by 29 percent with 600 homes on the market. Benton County has seen a slowing housing market with more listings, fewer closings yet higher median sales prices. Its months supply of inventory has increased by 70 percent with more homes on the market. Carroll County has had drops in new listings, sales, median home prices and inventory of homes for sale, yet a slightly higher supply of inventory. In the MSA, the total inventory of homes for sale has dropped by 18 percent.
Table 4: Lafayette MSA residential real estate sales
| Lafayette MSA | Benton County | Carroll County | Tippecanoe County | |||||||||
|---|---|---|---|---|---|---|---|---|---|---|---|---|
| Year to date* | Year to date* | Year to date* | Year to date* | |||||||||
| 2015 | 2016 | Change | 2015 | 2016 | Change | 2015 | 2016 | Change | 2015 | 2016 | Change | |
| New listings | 2,749 | 2,669 | -2.9% | 87 | 91 | 4.6% | 191 | 188 | -1.6% | 2,471 | 2,390 | -3.3% |
| Closed sales | 1,959 | 2,055 | 4.9% | 62 | 47 | -24.2% | 146 | 133 | -8.9% | 1,751 | 1,875 | 7.1% |
| Median sales price | n/a | n/a | n/a | $70,000 | $72,950 | 4.2% | $121,500 | $116,500 | -4.1% | $141,000 | $148,000 | 5.0% |
| September 2016 | September 2016 | September 2016 | September 2016 | |||||||||
| Months supply of inventory | n/a | n/a | n/a | 5.6 | 9.5 | 69.6% | 6.6 | 7.1 | 7.6% | 4.2 | 3 | -28.6% |
| Inventory of homes for sale | 916 | 752 | -17.9% | 37 | 50 | 35.1% | 104 | 99 | -4.8% | 775 | 603 | -22.2% |
Note: Data reflect January to September for both years. Months’ supply of inventory and inventory of homes for sale are September values.
Source: Indiana Association of Realtors
Nationally, the housing market is stronger than one year ago, with increases in sales in both existing homes and new single-family homes. Existing-home sale prices have increased, whereas new single-family home prices have dropped slightly. Many of the trends evidenced in Tippecanoe County are also happening nationally. The limited supply of homes is causing prices to rise, thus reducing the affordability factor.
Within the Lafayette MSA, the housing situation will likely remain mixed based on location. Within Tippecanoe County, current trends are expected to continue in 2017 (i.e., diminishing housing supply due to increased sales and fewer listings, as well as increased sales prices or sellers able to receive close to their original asking price). In the more rural areas of the MSA, the housing market will remain volatile.
Given the past trends of a gradually tightening existing-housing market, it provides some insight into why Tippecanoe County has seen an uptick in housing permits issued in 2013 and 2014 (2,166 issuances). However, only half of these permits were for single-family housing—reversing more recent trends of tepid interest in multifamily dwellings. In 2015, the MSA did see a contraction in permits issued from the prior year (see Figure 2). Thus far in 2016, housing permits issuances are up and will likely eclipse the 2015 issuances.
Figure 2: Lafayette MSA residential building permits
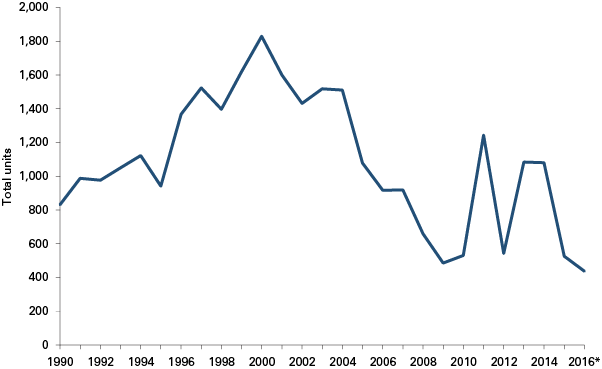
* 2016 reflects year-to-date figures through September 2016 for Tippecanoe County only.
Source: STATS Indiana, using U.S. Census Bureau data
In 2017, if the reduction in homes for sale continues, we can anticipate stronger demand to build homes. It is expected that median sales prices will likely continue to rise as the area reduces its inventory of existing homes for sale.
Conclusion
Growth continued within the Lafayette MSA in 2016, but at a tepid pace. Surprisingly, much of the employment growth in 2016 centered around goods production—in the manufacturing and mining/logging/construction industries. While a 1.5 percent growth in manufacturing is not overly dramatic, the size of the industry quickly generates employee impacts.
The MSA continues to maintain a favorable unemployment rate, job growth and slight wage growth. Individuals are still attracted to the Lafayette MSA, as evidenced by the population growth and demand for housing (both existing and new). The MSA is buoyed by the presence of Purdue University and its research park.
Looking forward, national trends do not indicate any major changes in the slow-and-steady pace of recovery. Despite the attractive and diverse economic array of businesses and amenities, it is not expected that Lafayette MSA will serve as an outlier to these national trends in 2017. Nevertheless, economic growth in the region will continue; however, it will likely be in non-manufacturing industries with minimal wage increases.
Notes
- The data show an increase in private educational and health services. Given that only private educational facilities are included, much of the growth tends to be derived from health services.
- For more research on differences between the U.S. and Indiana PCPI, see “Occupational Hazard: Why Indiana’s Wages Lag the Nation” and "Finding New Cheese: Why Indiana’s Per Capita Personal Income Lags (and How to Fix It)" in the Indiana Business Review.
