
Indiana’s outlook for 2017
Director of Economic Analysis, Indiana Business Research Center, Kelley School of Business, Indiana University
Assistant Professor of Finance, Indiana University Division of Business, Indiana University–Purdue University Columbus
If there is a common thread through our economic forecasts over the last few years, it has been uncertainty. Since the Great Recession, the national economy’s performance has been anything but vigorous. But, whether the economy has been weighed down by uncertainties—government shutdowns, the effects of the Affordable Care Act (Obamacare) on small businesses, the effect of Federal Reserve interest rate policy, the economic slowdown of large emerging economies like China—we’ll leave to the historians. But one thing is certain: The national economy has had a series of unexceptional (to put it gently) years of economic performance.
That’s the bad news.
The good news, at least for Indiana, is that this last year or two have been pretty good, especially compared to our neighboring states. Over the last six years, 2009 to 2015, Indiana’s average growth in chained-dollar, or “real,” gross domestic product (GDP)—also known as gross state product (GSP)—was only barely edged out by Michigan’s average for the same time period, 2.2 percent versus 2.3 percent. Indiana’s current-dollar average GSP growth surpassed all neighboring states, although by a mere 0.1 percentage point relative to Michigan and Ohio.
Since the teeth of the Great Recession in 2009, we have also seen Indiana’s unemployment rate fall more quickly than neighboring states, except for Ohio. Indiana’s and Ohio’s unemployment trajectory since 2009 were similar. At the time of this writing, Indiana’s current unemployment rate was about equal to that of Michigan's, a state that took the greatest economic hit among Indiana’s neighbors, but has enjoyed an economic bounce thanks to robust auto sales in the last couple of years.
In terms of GDP (or GSP) growth, 2016 looks to reverse the trend of Indiana underperforming the overall nation. We currently forecast that 2016 will close out with real economic growth of 3.0 percent, compared to 1.6 percent nationwide.
GDP growth and employment
Indiana has trailed the U.S. in GDP growth for four out of the past five years, but is expected to grow at a slightly faster rate than the U.S. through 2018. Figure 1 shows the relationship between Indiana and U.S. GDP growth since 2006. We expect Indiana’s annual rate of real GSP growth in 2016 to be 3.0 percent, and the forecast for 2017 is 2.8 percent.
Figure 1: Annual change in gross domestic product
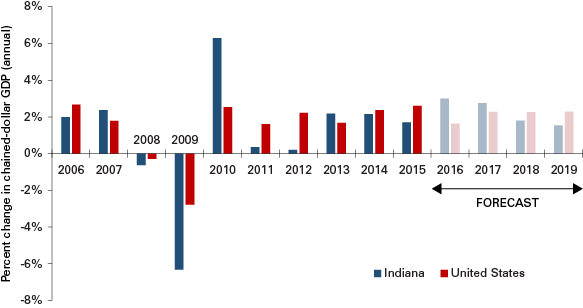
Source: IBRC, using U.S. Bureau of Economic Analysis and Indiana University Center for Econometric Model Research data
GSP is an aggregate of the value-added totals—mostly compensation and returns to capital—from many different industries, each with a different performance profile. Some industries or sectors may prosper, while others may not. In 2014, the GSP increases in manufacturing of both durable and nondurable goods were above the statewide growth rate. These increases, however, were offset by double-digit percent GSP decreases in mining and agriculture.
Indiana’s economic growth is greatly affected by the demand for Indiana’s goods and services internationally and from elsewhere in the country. That demand for the products and services that are produced in the state will drive growth in employment, compensation and overall economic output (GSP). Assumptions, therefore, of continuing strong demand in the auto sector will have an out-sized effect on the forecast of the state’s economic performance.
Was the auto, and more broadly total industrial, production hiatus in August (of 2016) just a blip? A pause to let the sector catch its breath? Or did it signal the beginning of a cooling sector? The answer to those questions may well influence the accuracy of our forecast.
So far, it has been a great year for auto sales. After a strong 2015 that saw auto sales hit over 17 million units, it looks like 2016 is on track to match that. Furthermore, various automotive industry analyst reports suggest that light vehicle sales in the United States are expected to near 20 million units by 2018, given no shocks to the economy.1 That said, the state’s fortunes don’t rise and fall with the auto sector. As it happens, the broadly defined “chemicals” industry, which includes the pharmaceutical industry, continues its march to dominate the state in terms of economic output (GSP), increasing its state’s share of GSP from about 5.6 percent in 2005 to 9.1 percent in 2014 (the last year for available industry GSP data). Over the same period, the share of motor vehicles, bodies and trailer manufacturing fell slightly from 5.5 percent to 4.9 percent over the same period, further emphasizing the importance of pharmaceutical manufacturing in Indiana. From 2017 to 2021, pharmaceutical manufacturers are expected to grow by 5.8 percent annually, providing some buoyancy to this sector.2
In terms of employment, the share of motor vehicles, bodies and trailer manufacturing—the auto sector—fell from 3.5 percent of Indiana workers in 2005 to 2.9 percent in 2015. (The employment data by industry are more timely than GSP.)3 The decline in manufacturing employment has been widespread across all manufacturing industries, with the exception of food and beverage manufacturing. Both durable and nondurable good manufacturing have shrunk as a share of Hoosier employment, with durable goods losing 1.7 percentage points from 2005 to 2015 and nondurables losing 0.3 percentage points.
Despite the general shrinkage in manufacturing employment in the Hoosier state over the last 10 years, one should note that the auto sector gained back nearly 35,000 jobs from 2009 to 2015.
The usual suspects (industries) increased their share of employment in the state, namely educational services (+0.4 percentage points) and health care and social assistance (+1.5 percentage points) over 10 years.
Figure 2 provides a glimpse of Indiana’s employment swings from before the Great Recession, as well as the job growth forecast for the remainder of 2016 through 2019.
Figure 2: Indiana employment growth
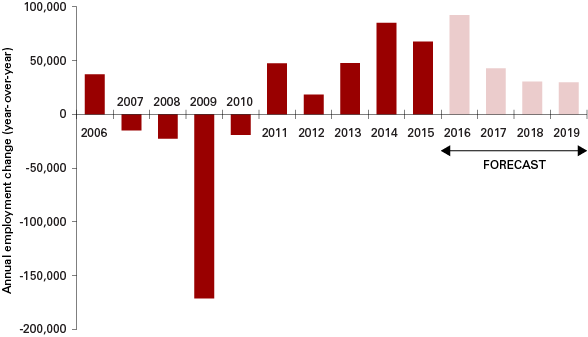
Source: IBRC, using U.S. Bureau of Labor Statistics and Indiana University Center for Econometric Model Research data
Labor force, population and age
Indiana maintains its number one position nationally in percentage of GSP earned via manufacturing, coming in ahead of our peer states in the surrounding region, as well as North Carolina, Oregon, and Iowa—all of whom taken together round out the top nine in manufacturing prowess across the country. To assess how Indiana compares to these states, we can look at unemployment in each of these states over the past five years (see Table 1).
Table 1: Unemployment rate for Indiana and peer manufacturing-heavy states
| August of each year | |||||
|---|---|---|---|---|---|
| 2012 | 2013 | 2014 | 2015 | 2016 | |
| U.S. | 8.2 | 7.3 | 6.3 | 5.2 | 5.0 |
| Indiana | 8.4 | 7.3 | 5.9 | 4.5 | 4.6 |
| Iowa | 4.9 | 4.5 | 4.1 | 3.5 | 4.2 |
| Illinois | 9.2 | 9.1 | 6.9 | 5.8 | 5.5 |
| Kentucky | 8.2 | 7.9 | 6.0 | 5.0 | 4.8 |
| Michigan | 9.4 | 8.9 | 7.3 | 5.2 | 4.9 |
| North Carolina | 9.5 | 7.8 | 6.7 | 5.9 | 5.0 |
| Ohio | 7.2 | 7.3 | 5.6 | 4.4 | 4.7 |
| Oregon | 8.7 | 7.6 | 6.8 | 5.7 | 5.6 |
| Wisconsin | 6.9 | 6.3 | 5.1 | 4.2 | 4.0 |
Source: U.S. Bureau of Labor Statistics
We see that as of August 2016, Indiana had a lower unemployment rate (4.6 percent) than the nation (5.0 percent), and its unemployment rate stood more favorably than its peer states, except Wisconsin (4.0 percent) and Iowa (4.2 percent). However, unemployment rates only tell part of the employment story in a given region. Other parts of the story include the age of the population, the percentage of the population who participate in the labor force and the educational attainment level of the residents.
To the first point about age, Indiana is a relatively young state (see Figure 3). This statistic could be dismissed without much further thought; however, in terms of attracting new business and generating future production from a workforce, Indiana offers a relative advantage among the manufacturing leaders.
Figure 3: Median age among peer manufacturing states, 2015
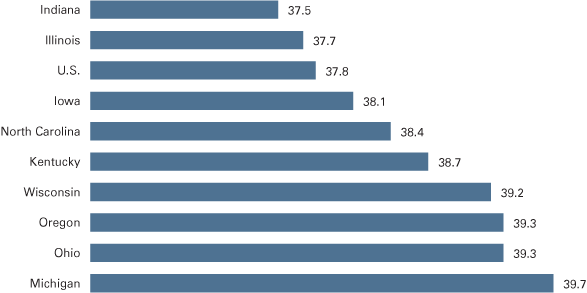
Source: U.S. Census Bureau
To address the second point of labor force participation, we analyzed a five-year period (2010-2015), as shown in Figure 4. Since 2012, Indiana has trended upward in terms of expanding its labor force as a percentage of its total population. Thus, when considering the unemployment rate of 4.6 percent, we couch that in terms of an increasing number of Hoosiers formally seeking employment. Taken together—a falling unemployment rate and an expanding labor force— these indicators are a good sign.
Figure 4: Labor force as a percentage of population among selected peers
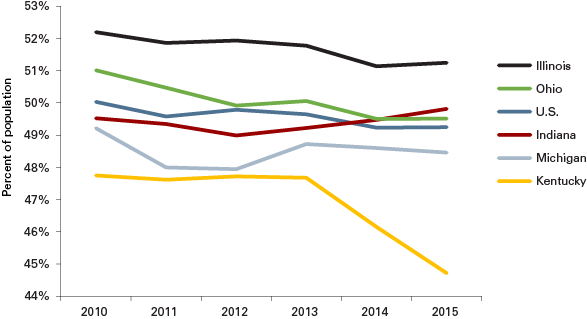
Source: U.S. Bureau of Labor Statistics and U.S. Census Bureau
Hoosiers are relatively young, have been increasingly employed in life sciences, and the automotive industry has recovered well since the gloom of the Great Recession. All these facts sound good. So, what is holding Indiana back from surging forward nationally in GSP growth? One possible answer is that Hoosiers need to continue to focus on becoming better educated.
Education and per capita income
With spending rates at around 95 percent of earnings, when people earn more money, GSP will rise. So, how do we increase personal income? After all, who doesn’t want to earn more income? It turns out that populations having a higher proportion of citizens with baccalaureate degrees earn more money.
In looking at the nine-state region—Indiana’s peer manufacturing powerhouses—over an 11-year period (annual data) for each state, regression analysis suggests that for every percentage increase in baccalaureate attainment in a given state’s population, that state’s personal income per capita rises by about $713. The statistical relationship is strong, with 79 percent of the variance in income level explained by educational attainment level.4 Figure 5 shows a graphical relationship between higher educational attainment and personal income. (An earlier article in this publication compared all 50 states and found a similar relationship.5)
Figure 5: Baccalaureate attainment and its association with personal income, 2015
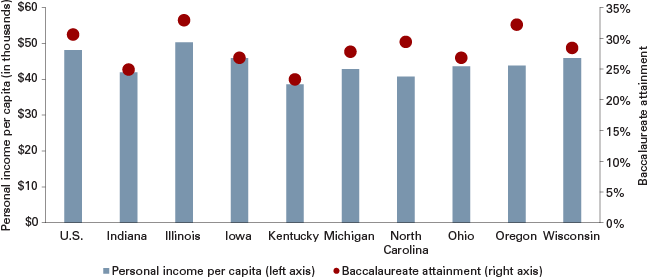
Source: R. Brewer of Indiana University–Purdue University Columbus, using U.S. Census Bureau and U.S. Bureau of Labor Statistics data
This implies that a more-educated workforce makes more money. Not terribly surprising. However, according to the U.S. Census Bureau, as of 2015, Indiana ranked 42nd out of 50 states on baccalaureate attainment. Among the states in the manufacturing peer group, only Kentucky had a lower percentage of college graduates (see Table 2). Consequently, we notice an opportunity to turn up the dial in Indiana for future GSP improvement with a focus on continued higher educational development of Hoosiers.
Table 2: Baccalaureate degree attainment in the Manufacturing Belt
| Year | U.S. | Indiana | Illinois | Iowa | Kentucky | Michigan | North Carolina | Ohio | Oregon | Wisconsin |
|---|---|---|---|---|---|---|---|---|---|---|
| 2010 | 28.2% | 22.7% | 30.8% | 24.9% | 20.5% | 25.2% | 26.5% | 24.6% | 28.8% | 26.3% |
| 2011 | 28.5% | 23.0% | 31.0% | 25.8% | 21.1% | 25.6% | 26.9% | 24.7% | 29.3% | 26.5% |
| 2012 | 29.1% | 23.4% | 31.6% | 26.3% | 21.8% | 26.0% | 27.4% | 25.2% | 29.9% | 27.1% |
| 2013 | 29.6% | 23.8% | 32.1% | 26.4% | 22.6% | 26.9% | 28.4% | 26.1% | 30.7% | 27.7% |
| 2014 | 30.1% | 24.7% | 32.8% | 27.7% | 22.2% | 27.4% | 28.7% | 26.6% | 30.8% | 33.6% |
| 2015 | 30.6% | 24.9% | 32.9% | 26.8% | 23.3% | 27.8% | 29.4% | 26.8% | 32.2% | 28.4% |
Source: U.S. Bureau of Labor Statistics
While work remains to be done, Indiana has improved its educational attainment level over the past 10 years. Between 2005 and 2015, Indiana has outpaced all of its peer-group states, except Kentucky, on growth in baccalaureate degree attainment (see Figure 6). Of course, Kentucky and Indiana have the most work to do here to catch up with both the national average and their peers.
Figure 6: Growth of baccalaureate degree attainment, 2005 to 2015
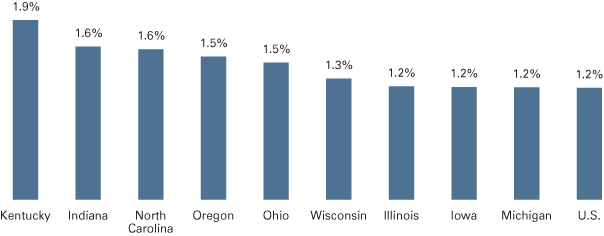
Source: U.S. Census Bureau
Conclusion
Heading into 2017, Indiana is generally on the right track for continued economic growth considering several key dimensions:
- Indiana’s manufacturing base over the last eight years has diversified a bit away from automotive and has added additional defensive presence with life sciences and global transportation business, each of which is expected to grow from 2 percent to 6 percent over the coming year.
- Indiana has a healthy blend of a comparatively low unemployment rate alongside an increasing labor force participation rate.
- Indiana has the youngest population in the nine-state manufacturing-heavy peer group, which can help in terms of generating productivity—particularly now as the U.S enters the front-end of retirements for the baby boomers.
- Over the last 10 years, Hoosiers have outpaced peer states in baccalaureate attainment growth, although Indiana still lags behind those peer states and the U.S. as a whole.
For 2017, we suspect Indiana will see GSP growth near or slightly above the expected GDP growth rate of the U.S. For the longer term, many risks (some quite unusual) and opportunities exist in global markets, financial markets, and in terms of national policy and fiscal incentives. A continued emphasis on employment diversification and educational attainment will create a brighter long-term forecast for Indiana’s economy.
Notes
- See “Light Vehicle Sales from 2007 to 2021, by Major Market,” Statistica.com, accessed October 19, 2016, www.statista.com/statistics/383003/forecast-for-light-vehicle-sales-by-major-market/; Brent Snavely and Greg Gardner, “Study: Auto Industry’s Sales Boom will Last to 2018,” USA Today, May 13, 2016, www.usatoday.com/story/money/cars/2016/05/12/study-auto-industrys-sales-boom-last-2018/84266302/; Robert Miles, “Automobile Engine & Parts Manufacturing in the US,” IBISWorld Industry Report 33631, September 2016.
- Sarah Turk, “Brand Name Pharmaceutical Manufacturing in the US,” IBISWorld Industry Report 32541a, August 2016.
- All data items, including “full and part-time employment” are as reported by the U.S. Bureau of Economic Analysis (Table SA25N).
- The statistical relationship is significant, or confirmed, as shown by the t-statistic of greater than 10, as shown in the table below:
- For more elaboration, see Timothy F. Slaper, “Finding New Cheese: Why Indiana’s Per Capita Personal Income Lags (and How to Fix It)," Indiana Business Review, Spring 2013, www.ibrc.indiana.edu/ibr/2013/spring/article1.html.
| Coefficient | Robust standard error |
t-statistic | p-value | |
|---|---|---|---|---|
| Baccalaureate attainment | 712.93 | 70.79 | 10.07 | 0.00 |
| Year effects removed? | Yes | |||
| Adj. r-squared | 0.79 | |||
| Observations | 99 | |||
| Number of states | 9 | |||
| Number of years | 11 |
Source: R. Brewer at Indiana University–Purdue University Columbus, using U.S. Census Bureau and U.S. Bureau of Labor Statistics data

The Indiana Business Review is a publication of the Indiana Business Research Center at Indiana University's Kelley School of Business. Permission to use the material is encouraged, but please email us at ibrc@iu.edu to indicate you will be using the material and in what other publications. Privacy Notice