Bloomington Forecast 2013
Director of Economic Analysis, Indiana Business Research Center, Kelley School of Business, Indiana University
Research Assistant, Indiana Business Research Center, Kelley School of Business, Indiana University
Not all good news is good. A reader of The Atlantic Cities in early September would have learned that Bloomington, Indiana, from 2010 to 2011, was the second-best metro for a pay raise in the whole country.1 Wow! Bloomington is doing well! What a great place to live!
But the correct response to this revelation would be, “Huh? Say what?” The report was too good to be true. The claim was supported by a dubious use of data. Bloomington’s average increase in wages was not in fact 7 percent in one year, but a more modest 2.7 percent. That’s a rather average increase, but average can feel pretty good when many other localities have been hit harder. The Bloomington Metropolitan Statistical Area (MSA) has emerged from the Great Recession in reasonably good shape, and the forecast for the Bloomington area is reasonably good too.
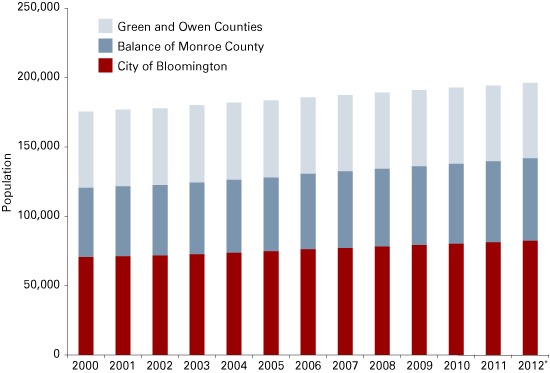
The Bloomington area sustained considerable population growth over the past decade. As a whole, the MSA’s population grew by around 10 percent, roughly equivalent to the national average. As Figure 1 shows, this growth occurred entirely within Monroe County. In contrast, the combined population of Greene and Owen counties has remained relatively constant, with a slight decrease over the last decade. This trend is projected to continue. Data from Moody’s Economy.com suggest that growth in Monroe County will push the Bloomington MSA population to 200,000 by 2014.
Figure 1: Bloomington MSA Population, 2000 to 2012
Note: 2012 to 2013 data are projected.
Source: Bureau of Economic Analysis and Moody’s Economy.com
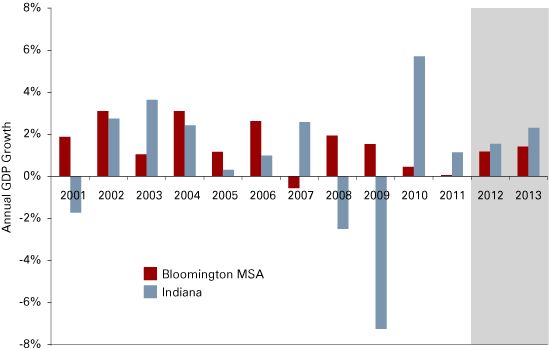
The Bloomington MSA did not suffer the setback in economic growth that the state of Indiana did over the last half decade. However, this also means that the recovery has not been quite as rapid. In fact, Bloomington’s gross domestic product (GDP) only dropped in one year, 2007, by a paltry 0.6 percent. In contrast, Indiana’s GDP dropped 2.5 percent in 2008 and 7.6 percent in 2009 (see Figure 2). As a result of this, the rebound in economic growth has been sharper for Indiana than for Bloomington. Indiana’s economy grew by 5.7 percent and 1.1 percent in 2010 and 2011, respectively. In the same years, the Bloomington MSA’s economy grew by only 0.5 percent and 0.1 percent, respectively. Projections have the state and the MSA tracking a little more closely in the coming years though: Growth is expected to be fairly similar for 2012 and 2013, albeit with Indiana still growing at a faster rate.
Figure 2: Bloomington MSA and Indiana Gross Domestic Product Growth, 2001 to 2013
Note: 2012 to 2013 data (shaded) are projected.
Source: Bureau of Economic Analysis and Moody’s Economy.com
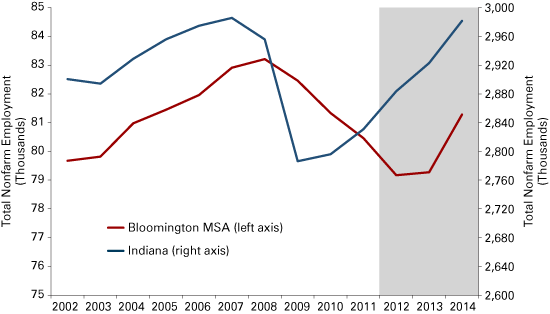
Employment is a somewhat different story. While the Bloomington MSA’s employment did not see the steep drop in 2009 that Indiana did, its employment has steadily declined since the financial crisis—even as employment has been steadily recovering across the state (see Figure 3). As a result, Indiana is expected to have recovered all the jobs lost in the last recession by 2014. In contrast, Bloomington is still expected to be well off its pre-recession highs at that time.
Figure 3: Bloomington MSA and Indiana Employment, 2002 to 2014
Note: 2012 to 2014 data (shaded) are projected.
Source: Bureau of Labor Statistics and Moody’s Economy.com
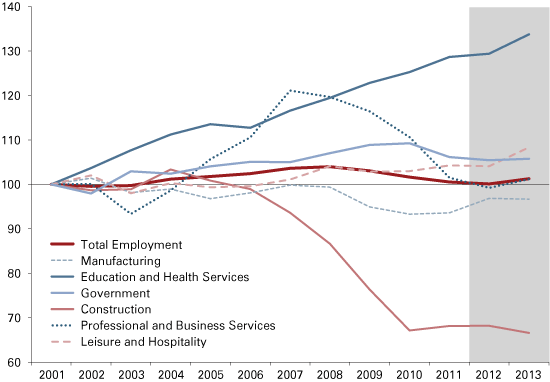
If we disassemble the Bloomington MSA’s aggregate employment into industry sectors, we can begin to understand the reasons for the slow employment recovery. As might be expected given the importance of Indiana University to the area, employment in the education and health services sector has continued on an upward trajectory almost unabated. Construction employment, on the other hand, has suffered significantly since the housing bubble burst (see Figure 4). One ray of hope is that the bleeding in this sector seems to have finally stopped. Projections for employment in construction are basically flat for 2012 and 2013.
Figure 4: Industries in the Bloomington MSA with Notable Employment Gains and Losses, 2001 to 2013
Note: 2012 and 2013 data (shaded) are projected.
Source: Bureau of Economic Analysis and Moody’s Economy.com
One surprising area of job loss is the professional and business services sector. This sector had experienced remarkable growth prior to the recession, but has since dropped to 2001 employment levels. Projections do not see this sector growing very much in employment over the next couple of years.
The gap between Bloomington’s per capita personal income (PCPI) and Indiana’s has remained relatively constant over the last decade (see Figure 5). There was a temporary narrowing in 2009 as the broader economy constricted and the Bloomington economy was relatively insulated from the economic storm. Since then, the gap has widened back to traditional levels and forecasts do not suggest any major changes in the coming years. At $31,079 and $35,550, respectively, it is disquieting to note that the Bloomington PCPI and the Indiana PCPI remain well below the U.S. PCPI, which stood at more than $41,000 in 2011. As is typical with college towns, Bloomington’s PCPI is diluted by its large student population.
Figure 5: Bloomington MSA and Indiana Per Capita Personal Income, 2002 to 2014
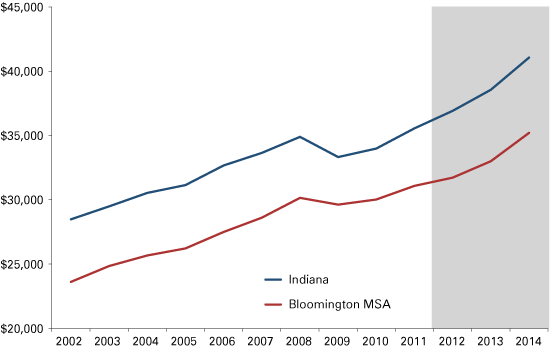
Note: 2012 to 2014 data (shaded) are projected.
Source: Moody’s Economy.com
The condition of local residential construction is also disquieting, especially if compared to the years early in the century, as shown in Figure 6. The number of permits in 2009 to 2011 was less than 25 percent of the level in 2002 to 2004. Market conditions seem to have hit bottom, however. Based on Census Bureau data, the year-to-date total for August 2012 (at the time of this writing) topped 300 units. As the regional economy goes from stabilizing to growing, the residential construction market will benefit.
Figure 6: Monroe County Residential Building Permits, 2000 to 2012
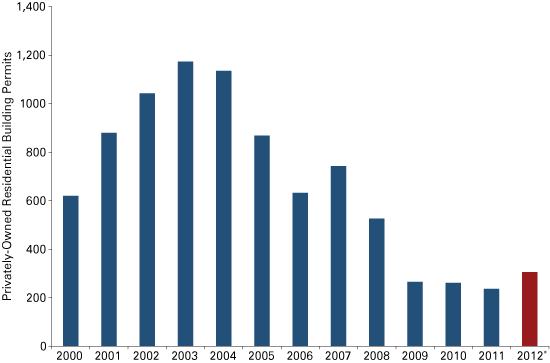
*2012 data show the cumulative year-to-date value as of August.
Source: U.S. Census Bureau
That growth may be fueled by the increasing connectivity of Bloomington to south-central Indiana by the completion of Interstate 69. As the transportation linkages grow, Crane NSWC will increase in its importance for Bloomington and the regional economy. Crane employs about 4,000 people. A large portion of those employees live in Bloomington and may increase as the technology park at Crane’s Westgate expands. In Daviess County alone, employment in professional, scientific and technical services jumped from just over 150 to 700 in five years. One might expect that Westgate-based workers seeking entertainment and cultural amenities would put down roots in Bloomington and its environs, adding to its growth and economic vitality.
Note
- Richard Florida, “America’s Best Places for a Raise,” The Atlantic Cities, September 3, 2012, www.theatlanticcities.com/jobs-and-economy/2012/09/americas-best-places-raise/3101/.
Also in this Issue…
- International Outlook for 2013
- U.S. Outlook for 2013
- Financial Outlook for 2013
- Indiana's Outlook for 2013
- Indiana's Agricultural Outlook for 2013
- Three Key Indicators—Forecasts for Jobs, Income and Productivity
- Anderson Forecast 2013
- Bloomington Forecast 2013
- Columbus Forecast 2013
- Evansville Forecast 2013
- Fort Wayne Forecast 2013
- Gary Forecast 2013
- Indianapolis-Carmel Forecast 2013
- Lafayette Forecast 2013
- Louisville Forecast 2013
- Muncie Forecast 2013
- Richmond Forecast 2013
- South Bend and Elkhart Area Forecast 2013
- Terre Haute Forecast 2013


