Gary
Associate Professor of Economic, Indiana University Northwest, Gary
Northwest Indiana (1) continues to struggle to recover from the recession that began in the spring of 2001 and ended in the fall of the same year. While the recession was brief and relatively mild nationally, total employment in northwest Indiana fell by about 2 percent immediately, and, in 2005, is about 3 percent below its 2001 level. (2) Average annual earnings per worker should remain relatively unchanged in 2006 (compared with 2005). Meanwhile, a shrinking labor force (down by 2.5 percent between 2001 and 2004, and projected to decline by another 0.7 percent by 2006) has accompanied a slowly falling unemployment rate.
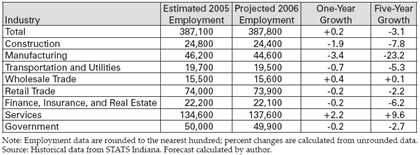
Between 2005 and 2006, employment should rise very modestly—by about 0.2 percent, or 700 new jobs. This increase in total employment masks declines in almost every industry sector—only service employment will grow significantly (3,000 additional jobs, a 2.2 percent increase over the 2005 level), with employment outside of services declining by about 2,300 jobs. The unemployment rate is likely to fall, from 5.9 percent in 2004 to 5.8 percent in 2005 to 5.7 percent or 5.6 percent in 2006. However, this decline is a result of a declining labor force, not of employment growth.
Employment
Figure 1 charts the changes in total employment in northwest Indiana from 1969. Most recently, total employment peaked in the late 1990s and began a slow descent, which has not yet decisively been halted. Although employment should rise slightly in 2006, that increase will leave total employment at about the level it reached in 1996. Table 1 presents expected 2005 and projected 2006 employment levels by major industry classifications and 2005–2006 and 2001–2006 employment growth rates.
Figure 1
Total Employment
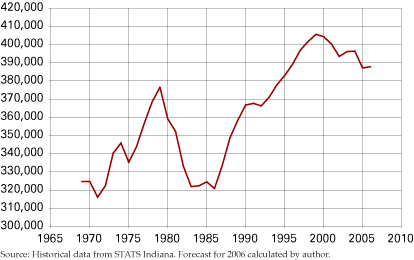
Table 1
Employment and Employment Growth by Industry
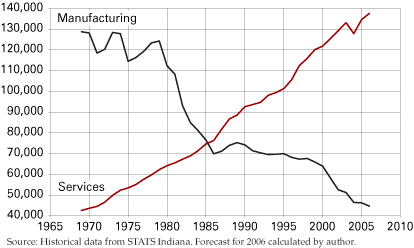
Manufacturing: The decline in total employment also shows up in manufacturing employment, which continues its steady decline. About 22,000 manufacturing jobs have been lost since 1996, and employment should decline by about another 1,600 jobs between 2005 and 2006. Much of this decline has occurred in the steel industry, with about 9,000 jobs lost in the 1996–2005 period. Employment in steel appears, however, to have stabilized at about 20,000 jobs and should maintain that level in 2006.
Services: Only service employment has shown any strength in recent years, and, indeed, service employment has become the dominant sector of the local economy, at least in terms of employment (see Figure 2, which shows the reversal in importance of manufacturing and service employment). Within the service sector, the most rapid growth between 2001 and 2005 occurred in health care (+11.7 percent, with even more rapid growth in ambulatory health care and in nursing and residential care facilities). This rapid growth can be expected to continue, with perhaps 1,000 of the 3,000 new service jobs in health care. Employment in hospitals was essentially unchanged. Employment in professional, scientific, and technical services (3) rose by 8 percent between 2001 and 2005, with 700 new jobs being created. Although the growth here is likely to continue to be strong, only about 150 new jobs are likely to be added between 2005 and 2006.
Figure 2
Manufacturing and Services Employment
Transportation, Distribution, and Logistics: This sector has been identified as having the potential to provide major stimulus to the northwest Indiana economy. (4) Certainly, northwest Indiana is well positioned to take advantage of a nationwide transportation network, including rail, truck, and air transportation. Data sources do not provide data on the number of establishments or on employment in air and rail transportation, as the number of firms is too small to permit such publication. Trucking has grown locally from 2001 to 2005, with about 900 additional jobs (nearly 15 percent growth), although the number of firms has declined slightly. The past five years in wholesale trade shows a mixed picture, with fluctuating employment, but a 7 percent increase in the number of firms. Overall, employment in these two industries looks to be about the same in 2006 as in 2005.
Other Sectors: No other sectors are likely to experience either rapid growth or decline. Of some interest are the employment developments in construction. Construction employment has grown very slowly in Lake and Porter counties (growing about 5 percent between 2001 and 2005) and has been about unchanged in La Porte County. This suggests that construction employment has been declining in the less urban counties of northwest Indiana, and that the expected decline in 2006 is also likely to be concentrated in Jasper, Newton, Pulaski, and Starke counties. In addition, it is difficult to reconcile the slow growth in construction employment with the anecdotal perception of construction as a thriving sector. Housing construction appears to have been quite strong, and highway construction appears to be everywhere. In fact, employment in heavy and civil engineering construction has grown by about 10 percent since 2001.
Unemployment: The unemployment rate in northwest Indiana has generally tracked the changes in the national economy, declining in the late 1990s, rising through the 2001 recession, and declining slowly since 2002. The unemployment rate, averaging about 5.8 percent in 2005, should continue to decline to 5.6 percent or 5.7 percent in 2006. However, this does not necessarily represent any noticeable strengthening of the labor market. As noted above, employment will grow very modestly. The driving force in lowering the unemployment rate is, it turns out, a continuing decline in the labor force of northwest Indiana.
The labor force—residents of northwest Indiana who are either employed or seeking work—peaked in the late 1990s and has declined since. The decline between 2001 and 2004 was about 2.5 percent, with about 10,000 fewer people in the labor force. By 2006, the total decline in the labor force projects to a little over 12,000 workers, with the decline between 2005 and 2006 coming in at about 1,000. With fewer people participating in the labor force, firms will experience difficulty in expanding employment rapidly. It seems likely that the decline in the labor force has been one of the factors leading to slow employment growth. The slow growth in the labor force reflects the slow growth in, and aging of, the population. Total population has grown by only 3 percent in the last thirty years, and about 13 percent of the population was age 65 or older in 2003 (a share that continues to rise over time). (5)
Earnings
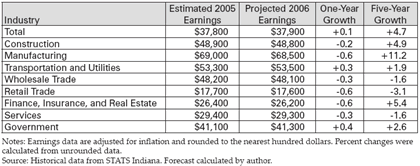
Table 2 shows average annual (real) earnings per worker, for all workers and by industry; data for the 1969–2006 period for all workers compared to manufacturing workers is shown in Figure 3. Total average annual earnings peaked in northwest Indiana in 1978, at about $47,200, and have subsequently declined to about $37,800 in 2005. Predicted annual earnings for all workers in 2006 are $37,900, an increase of about 0.3 percent. Much of the decline in average earnings can be attributed to a change in the industrial composition of employment, particularly the decline in manufacturing employment (where annual earnings were about $70,000 in 1978, projected to be about $68,500 in 2006) and the rise in service employment (with earnings of about $30,500 in 1978 and $29,200 in 2006).
Table 2
Average Annual Real Earnings per Worker and Earnings Growth by Industry
Figure 3
Average Annual Earnings for All Workers and Manufacturing Workers
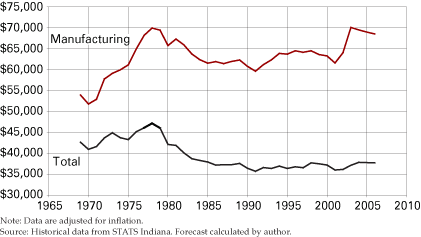
Real earnings growth from 2001 to 2006 has been adequate, if not spectacular, averaging 4.7 percent, with even more rapid growth in construction, manufacturing, and in the financial sector. The earnings growth in manufacturing has been led by very strong earnings growth in the steel industry, where average annual earnings rose by about 30 percent, largely as a result of increased overtime pay. Outside of steel, earnings in manufacturing have declined from 2005 to 2006.
Earnings growth over the next year will be very weak across industries in all likelihood, a consequence of the slow growth in employment. In addition, the slow growth in earnings will contribute to slow growth in retail trade and in services.
Conclusions
Northwest Indiana will continue its slow growth. Employment and earnings will grow more slowly than in the state, even as Indiana grows more slowly than the nation. Employment growth of about 0.2 percent with an earnings increase of about 0.3 percent will lead to roughly constant total labor income in the region in 2006 compared with 2005. Slow growth in employment will place downward pressure on earnings growth, and reduced earnings growth will place downward pressure on employment growth in the retail sector and in services. The unemployment rate will decline fractionally, largely as a result of a continued decline in the labor force.
The short-term outlook for the northwest Indiana economy continues to be discouraging.
Notes
- Beginning with the 2006 outlook, the northwest Indiana region will consist of seven counties: Jasper, Lake, La Porte, Newton, Porter, Pulaski, and Starke. Slightly more than 90 percent of the region’s employment is located in Lake, La Porte, and Porter counties.
- All data on employment, unemployment, and earnings in this report come from STATS Indiana (www.stats.indiana.edu), or are estimates and forecasts prepared by the author.
- This includes lawyers offices, accounting firms, architectural and engineering firms, etc. See www.census.gov/eos/www/naics/ for complete details on the NAICS industrial classification.
- Northwest Indiana Times, 30 October 2005, p. 1.
- About 26 percent of the population was under 18 in 2003, a percentage that has also increased in recent years.
Also in this Issue…


