New Albany
School of Business, Indiana University Southeast
Economic indicators for southern Indiana show mixed results for 2005. Average employment in the Louisville Metropolitan Statistical Area (metro), and in southern Indiana in particular, increased for the second year in a row. Yet, indicators of consumer activity suggest that consumers may be starting to reign in spending. In this analysis, various measures of economic activity are examined for counties in the Louisville metro. Particular attention is paid to Clark, Floyd, Harrison, and Washington counties in southern Indiana and Bullitt, Jefferson, and Oldham counties in northern Kentucky. Four additional Indiana counties—Crawford, Jefferson, Orange, and Scott—in the southern Indiana labor market area are included when available.
Labor Markets
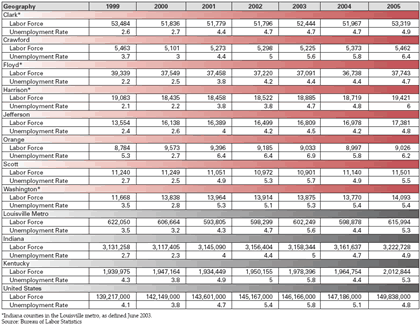
September unemployment rates in many of the Indiana counties of the Louisville area increased from September 2004 to 2005. From month to month, unemployment rates in many of these counties have actually decreased from earlier this year but continue to be quite volatile. Over the past year, unemployment rates in these counties grew to exceed that of the United States and the Indiana state average. Table 1 suggests that part of the increase in unemployment rates in these counties can be attributed to increasing labor force participation; as job opportunities have increased, people who had dropped out of the labor force have begun looking for jobs. Clark, Floyd, and Scott counties, in particular, have shown substantial increases in labor force participation.
Table 1
Labor Force and Unemployment Rates, September of Each Year, 1999 to 2005
Recent data for the Louisville metro indicates that the average level of nonagricultural employment was 603,600 for the January–September 2005 period, an increase of approximately 6,600 jobs from the same period last year and approximately 16,000 jobs below the 2000 peak of 620,000. Manufacturing jobs decreased by approximately 200 jobs in the metro area, while average weekly earnings in that sector declined an additional $30 to $766 for the January–September period. Metro area employment in retail sales continued its decline to 64,200 from a high of 70,500 in 1999.
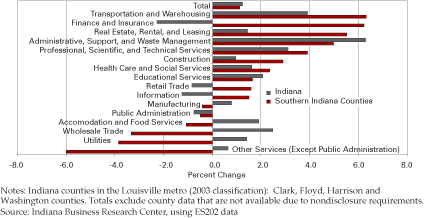
Total employment has steadily increased in the southern Indiana counties, gaining over 1,000 jobs in the first quarter of 2005 from the same quarter in 2004 (see Figure 1). Job growth in the southern Indiana counties was led by transportation and warehousing (367 jobs) and health care and social services (261 jobs). Positive growth continued in several other sectors, including construction, retail trade, finance and insurance, administrative and support services, and educational services.
Figure 1
Percent Change in Employment, 2004:1 to 2005:1
Manufacturing employment in the southern Indiana metro counties continues to decline (although at a slower rate), averaging just over 18,000 jobs for the first quarter 2005, a decline of just over 70 jobs over the same period in 2004. Manufacturing employment has steadily decreased from the 2001 peak of approximately 21,000 jobs. Despite significant job losses over the past several years, manufacturing remains the largest employment sector in southern Indiana with over 20 percent of total employment. The average weekly wage for manufacturing workers in southern Indiana has continued to increase, but remains consistently lower than that of the Louisville metro as a whole and the state of Indiana. While there is no standard measure of labor productivity for metropolitan areas, national averages suggest that labor productivity in manufacturing has increased substantially, which would boost wages.
Consumer Activity
Sales and Marketing Management magazine’s 2005 Survey of Buying power shows continued increases in retail sales. Total retail sales in the Louisville metro increased by 5.7 percent from $13.9 billion in 2004 to $14.7 billion in 2005. This is significantly lower than the 11.6 percent increase in metro retail sales from 2004 to 2005, suggesting a dampening in consumer spending. Jefferson County, Ky. had the largest change with over a $449,000 increase between 2004 and 2005. Oldham County, Ky., Floyd County, and Harrison County had substantial positive growth in retail sales, at 18.0 percent, 14.8 percent and 9.7 percent, respectively, while the growth in Clark County was quite modest (3.6 percent) by comparison. The increased retail spending in Floyd and Harrison counties may indicate a redistribution of spending patterns due to new retail development. Retail sales growth outpaced inflation, which was approximately 2.8 percent for the Midwest region between 2004 and 2005.
Activity in the residential housing market continued to increase over the past year, but at a slower pace than the previous year. Housing sales through October 2005 in the southern Indiana area totaled 2,959 units—an 8.1 percent increase, compared with 12.1 and 13.9 percent increases for the same time period in 2004 and 2003, respectively. The average sales price was $137,539 for January–October 2005 sales, up 4.2 percent from the year before. The average amount of time for a house to sell was 108 days; the 2004 average was 98 days.
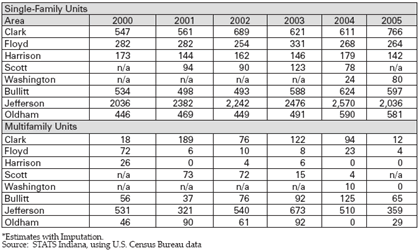
Residential construction as measured by residential building permits for new single-family units in the metro counties continued to slow and actually decreased in most metro counties (see Table 2). Permits for single-family units decreased by 9.7 percent for the January–September 2005 period. This is in sharp contrast to the 3.5 percent increase for the 2004 period and the 9.1 percent increase for the 2003 period. In addition, there was a substantial decrease of 38.8 percent in the number of permits issued for multi-family units. Only Clark and Washington counties experienced increases in single-family permits. Mortgage rates have been creeping up, contributing to the dampening of residential building permits and home sales.
Table 2
Building Permits, January through September*
Gaming at Caesars Casino experienced a decline in attendance in 2005. January through September 2005 admissions was 896,319, a 1.6 percent decrease from the same period in 2004 (see Table 3). Tax payments totaled over $18.9 million for the January–September 2005 period, a 4 percent increase over the same period in 2004.
Table 3
Caesars Indiana, Admissions and Total Taxes, January through September
In 2005, the available labor market data for Louisville and southern Indiana is fairly positive. While unemployment rates have increased and remain quite volatile, labor force participation has increased, suggesting that people are optimistic about finding jobs. Average employment increased by 6,600 jobs in the metro area, which includes an increase of over 1,000 jobs in the southern Indiana counties of the metro area. Consumer activity has dampened a bit. Retail spending in the Louisville metro continues to increase but at a slower rate and housing sales have increased relative to the previous year. The number of single-family residential building permits actually decreased in all counties except Clark and Washington, suggesting that the housing market is cooling. Cautious optimism is in order. Over the coming year, employment in the health care and transportation sectors are expected to remain strong. The dark cloud on the horizon is manufacturing employment, which continues to decrease. With the closing of the Colgate plant by January 2008, manufacturing will undoubtedly continue its decline. Retail spending will likely grow but at a slower rate, while activity in the housing market will continue to slow.
Notes
- In 2003, the Office of Management and Budget redefined the counties in the Louisville metropolitan area. They are Clark, Floyd, Harrison, and Washington counties in southern Indiana and Bullitt, Henry, Jefferson, Meade, Nelson, Oldham, Shelby, Spencer, and Trimble counties in Kentucky.
- Data on home sales from the Southern Indiana Realtors Association Multiple Listing Service, which covers Clark, Crawford, Floyd, Harrison, Jefferson, Scott, and Washington counties.
Also in this Issue…


