Columbus
Kelley School of Business, Indiana University
Columbus and Bartholomew County are sensitive places. When the U.S. economy is happy, the local area is very happy. When the U.S. economy is a little sad, Columbus and Bartholomew County feel terrible.
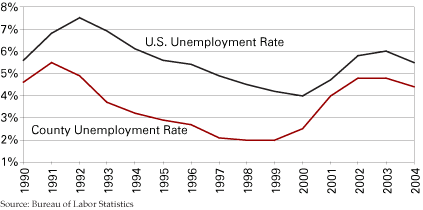
Figure 1 shows the historical patterns of unemployment, illustrating this special sensitivity. Coming out of the recession of the early 1990s, the U.S. unemployment rate improved by about 1.5 percentage points in the first two years of the recovery. Bartholomew County’s rate dropped faster, falling 2 full points. Unemployment in this area improved to a low point by 1998 and remained there in 1999, a decline of 3.5 points from its recent peak. The U.S. rate also shrank by 3.5 percentage points but took longer to get there.
Figure 1
Bartholomew County vs. United States Unemployment Rate, 1990 to 2004

This area tends to react quickly to changes in the national economy—sometimes even getting a head start. The recession of 2000 pushed the national unemployment rate up by 2 percentage points, starting in 2000. Sensitive Bartholomew County reacted more strongly. Its rate went up 3 points, and the problems started almost a year earlier.
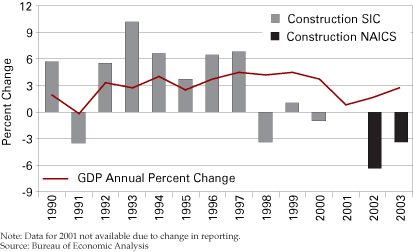
This pattern shows up in many sectors of the Bartholomew County economy. Take the construction industry: Figure 2 shows how that sector in Columbus and Bartholomew County has reacted to the general level of economic activity in the nation. The bars show the rate of growth or decline in construction employment in this county. The line tracks the annual percent change in U.S. gross domestic product (GDP). (There is no data point for Bartholomew County in 2001 because the definition of construction has changed between SIC and NAICS.)
Figure 2
Bartholomew County Construction Employment and U.S. GDP, 1990 to 2003

The dip in GDP in 1991 caused a big drop in the number of jobs. Afterwards the strong national recovery during the early 1990s led to even stronger growth rates in Columbus-area construction employment: the bars are higher than the GDP line. The relatively mild national slowdown in 2000, however, caused real whiplash locally. The last two years of available data show significant declines in jobs.
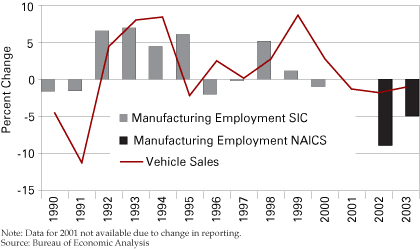
Bartholomew County’s manufacturing sector is big (more than 35 percent of all jobs in the county) but it reacts to national trends, too. One big influence is the level of vehicle sales. Figure 3 shows this relationship, once again showing percent changes. Sales of cars and light trucks in the United States exhibit wide swings in the annual percent change. But Bartholomew County’s manufacturing employment tracks these changes pretty closely. And the bad news is that vehicle sales are not likely to be as strong in 2006 as in some recent years. So local manufacturing employment probably will not rise much, either.
Figure 3
Bartholomew County Manufacturing Employment and U.S. Auto and
Light Truck Sales, 1990 to 2003

This historical sensitivity provides a way to think about Bartholomew County’s economic future. The forecast from Indiana University for the U.S. economy is cautiously optimistic. Assuming that interest rates and oil prices don’t climb more than expected, the U.S. GDP should expand at about the same rate as in 2005, or about 3.6 percent. That means the local construction industry should have a reasonably good year.
U.S. unemployment rates, however, are not forecast to improve much. So the unemployment rate in Bartholomew County probably will not get below 4 percent. The impressive numbers from the 1990s, when we saw unemployment rates here around 2 percent, just are not in the cards for next year.
Vehicle sales are a good indicator for the local manufacturing sector. And vehicle sales are not likely to improve much in the face of high fuel prices and rising interest rates in 2006.
Moves in the U.S. economy often translate into even bigger moves in the local economy. So watch the numbers for U.S. GDP, the national unemployment rate, and vehicle sales. If those numbers start to look better than expected next year, Bartholomew County could be very happy. But if the national situation turns out as forecasted, we’ll see little or no improvement in U.S. unemployment and vehicle sales. And that means 2006 is probably not going to show much new business or many new jobs in Columbus and Bartholomew County.
Also in this Issue…


