

Making the Indianapolis workforce more competitive
Clinical Associate Professor of Business Economics, Indiana University Kelley School of Business
Data Analyst, Indiana Business Research Center, Indiana University Kelley School of Business
New efforts to improve and expand the Indianapolis workforce underway
The 2023 Indiana General Assembly funded new Career Scholarship Accounts that pay for internships and apprenticeships connecting high school students with local employers to develop industry-needed skills.1 They additionally approved automatic enrollment for qualifying students in the 21st Century Scholars Program, which provides full scholarships for an associate or bachelor’s degree.2
Indianapolis-area mayors have formed a new Central Indiana Regional Development Authority to better collaborate for state funds that make the region more attractive for workers.3
The state’s Regional Economic Acceleration and Development Initiative (READI) program allocated $20 million in 2021 for the White River Regional Opportunity Initiative, which supports talent attraction and retention in Greater Indianapolis.4,5
The split of IUPUI into separate Indiana University and Purdue University campuses is expected to invigorate and grow the technically skilled workforce in Indianapolis.6
EmployIndy and Ascend Indiana launched the Modern Apprenticeship Program (MAP) in 2020 to generate paid employment for high school students that combines on-the-job learning, academics and development of industry-recognized credentials.7 In September 2023, the Indy Chamber Leadership Exchange will take more than 100 Indianapolis business, government and nonprofit leaders to Zürich to learn how the Swiss apprenticeship model can be applied to scale MAP in Central Indiana.8
High-skilled creative talent is the main driver of economic success in metropolitan regions.9 Transforming regions into hubs for such scarce talent is the focus of modern workforce policy. This occurs both through upskilling current residents and attracting well-trained and well-educated new residents. Talent recruitment has replaced business recruitment as the main concern for economic developers.
Positioning talent as the main driver for economic development is harder for regional economies historically structured and networked for manufacturing. Those economies evolved to support and reward large corporate enterprises, expansive fixed assets, economies of scale and productive use of low-skilled labor. Contrast this with the hallmark of modern competitive regions – well-networked industry clusters of small- and medium-sized enterprises that staff themselves with college graduates, leverage advanced technology and focus on entrepreneurial innovation.10 The preeminent modern region, Silicon Valley, arose out of farmland and fruit orchards; it was a greenfield venture.11 Birthing and building a 21st-century business ecosystem amidst industrial-era social and physical infrastructure is a harder task and frames the challenge of Midwestern regions like Indianapolis that were once the economic engine of the nation.12
Building a competitive workforce in Indianapolis faces major challenges
Among the 200 largest metropolitan areas in the United States in 2022, Indianapolis ranked 146th in job growth and 120th in wage growth in a report published by The Milken Institute.13 A 2014 Harvard study placed Indianapolis in the eleventh percentile in economic mobility among U.S. metropolitan areas.14 Among the 150 largest metropolitan areas, a 2023 analysis from WalletHub ranked Indianapolis 64th in workforce educational attainment and 88th in educational system quality.15
The data confirms that workforce transformation can only occur if Indianapolis removes structural impediments to improvements in human capital.16 Such impediments hold Indianapolis back while other regions advance. In May 2013, average hourly earnings of all employees in Indianapolis were 101% of the national average. Ten years later in May 2023, they were 90% of the national average.17,18
A 2022 study from Ascend Indiana and EmployIndy attributes part of this decline to a lack of skilled workers to fill high-paying jobs.19 Failure to reverse this trend will relegate the Indianapolis region to a peripheral source of value for industries that drive prosperity in the modern economy.
Our analysis focuses on the labor market, industry composition and drivers of economic growth anchoring the metropolitan region. Comprehension of workforce dynamics, employment patterns and demographic trends can help businesses, community leaders and policymakers formulate a strategy that makes Indianapolis more competitive.
Indianapolis and Indiana must confront a geographic poverty trap
Indianapolis is a major anchor for the Indiana economy, setting the pace for workforce performance. The metropolitan area accounts for 39% of state GDP and 36% of state personal income.20 A population of 2.1 million is 31% of the state’s population of 6.8 million. Population growth since 2020 of 1.5% more than doubled the state’s growth of 0.7%.21 Similarly, labor force growth of 3.7% since 2020 was more than twice the state’s growth of 1.8%.22,23
The metropolitan area’s unemployment rate of 2.8% in 2022 was even lower than the state unemployment rate of 3.0%.24,25 Average employee earnings of $29.84 per hour in metropolitan Indianapolis were 3% higher than the state average of $28.93 per hour in 2022.26,27 As a workforce leader for Indiana, Indianapolis can generate labor improvements that positively impact other regions in the state.
Table 1 identifies the 20 major occupations (out of 211) in Indianapolis with the highest workforce concentrations relative to national averages using Bureau of Labor Statistics (BLS) data from May 2022.28,29 By definition, a major occupation represents at least one in a thousand jobs (0.1% of employment) in Indianapolis. The location quotient (LQ) measures relative workforce concentration and is equal to the occupation’s local share of employment divided by the occupation’s national share of employment. An LQ greater than one implies occupational employment more concentrated than the rest of the nation and signals regional specialization in a certain type of work.
Of the 20 most concentrated major occupations, 13 align with three industries that dominate the Indianapolis economy – manufacturing, logistics (warehousing, storage and transportation) and health care. The Defense Finance Accounting Service (DFAS) headquarters generates the high concentration of financial specialists and payroll clerks, the U.S. Postal Service regional processing facility accounts for the high share of postal workers and the presence of 40 institutions of higher learning explains elevated LQs for science technicians and health specialty educators.30
The industries in which a region has comparative economic and geographic advantage naturally drive a disproportionate share of income growth. As witnessed in the Indianapolis region data, such industries typically determine which occupations have the highest relative concentration in a region. Logically, employment in these occupations is expected to grow faster than others.
Except for physicians, financial specialists and health specialty educators, occupations with the highest relative concentration in Indianapolis pay an annual wage lower than the national average. This offers a worrisome explanation for why wage growth in Indianapolis significantly lags the nation. When employment growth structurally depends upon expansion in low-wage jobs, regional economic innovation and productivity are foundationally low. The longer this persists, the stronger a region molds itself to specialize in serving peripheral and low-income segments of the U.S. economy. This seeds an expansion in relative poverty that becomes harder and harder to reverse over time.31
Table 1: Twenty major occupations in Indianapolis metro with highest employment concentration relative to the United States, 2022
| Occupation (SOC code) | Dominant industry | Metro LQ | State LQ | Share of metro workforce | Annual metro wage as % of U.S. average |
|---|---|---|---|---|---|
| Weighers, measurers, checkers, and samplers, recordkeeping (43-5111) | Warehousing and storage | 3.70 | 2.40 | 0.13% | 75% |
| General internal medicine physicians (29-1216) | Health care | 2.56 | 1.62 | 0.12% | 505% |
| Machinists (51-4041) | Manufacturing | 2.40 | 2.90 | 0.51% | 77% |
| Life, physical, and social science technicians, all other (19-4099) | Higher education | 2.34 | 1.47 | 0.11% | 99% |
| Laborers and freight, stock, and material movers, hand (53-7062) | Warehousing and Storage | 2.32 | 1.68 | 4.60% | 62% |
| Mixing and blending machine setters, operators, and tenders (51-9023) | Manufacturing | 2.01 | 2.46 | 0.15% | 78% |
| Psychiatric technicians (29-2053) | Health care | 1.83 | 1.99 | 0.13% | 61% |
| Interviewers, except eligibility and loan (43-4111) | Health care | 1.81 | 1.59 | 0.21% | 67% |
| Bus and truck mechanics and diesel engine specialists (49-3031) | Transportation | 1.79 | 1.76 | 0.33% | 87% |
| Industrial truck and tractor operators (53-7051) | Warehousing and storage | 1.73 | 1.68 | 0.91% | 67% |
| Multiple machine tool setters, operators, and tenders, metal and plastic (51-4081) | Manufacturing | 1.71 | 2.67 | 0.16% | 59% |
| Financial specialists, all other (13-2099) | Government | 1.70 | 0.79 | 0.15% | 132% |
| Payroll and timekeeping clerks (43-3051) | Professional services | 1.70 | 1.27 | 0.18% | 79% |
| Food batchmakers (51-3092) | Manufacturing | 1.70 | 1.78 | 0.19% | 70% |
| Packers and packagers, hand (53-7064) | Warehousing and storage | 1.69 | 1.38 | 0.75% | 55% |
| Automotive body and related repairers (49-3021) | Automotive services | 1.64 | 1.50 | 0.15% | 87% |
| Physicians, all other (29-1229) | Health care | 1.60 | 1.14 | 0.33% | 542% |
| Health specialties teachers, postsecondary (25-1071) | Higher education | 1.59 | 0.91 | 0.22% | 207% |
| Firefighters (33-2011) | Government | 1.57 | 1.29 | 0.34% | 96% |
| Postal service mail sorters, processors, and processing machine operators (43-5053) | Government | 1.55 | 0.79 | 0.13% | 84% |
Source: U.S. Bureau of Labor Statistics, Occupational Employment and Wage Statistics (OEWS)
The LQ comparisons reveal that occupations with the highest relative concentration in Indianapolis also typically exhibit high relative concentration within Indiana. There is a low average difference of 0.5 between quotients in absolute value terms.
Except for three outliers – payroll clerks tied to DFAS, higher education instructors and staff linked to the regional postal sorting facility – state LQs are above one. This reinforces the position of Indianapolis as a determinant of state workforce and industry trends and is not a surprise given that the metropolitan area accounts for over a third of the state’s economic activity. Thus, by extension, Indiana must manage the same geographic poverty trap threat that confronts Indianapolis. Both Indianapolis and Indiana face a race against time in their work to recharge and reinvigorate workforce performance.
Little advancement of the Indianapolis economy since the Great Recession
The Greater Indianapolis Chamber of Commerce (Indy Chamber) benchmarks Indianapolis against four peer metropolitan areas in other states – Charlotte, Columbus (OH), Denver and Nashville – in tracking the performance of the Accelerate Indy regional development strategy.32 These four regions mimic Indianapolis in terms of size, geography and economic structure but exhibit momentum to which Indianapolis can realistically aspire.
Talent development, business advancement, placemaking and regional brand amplification are the four pillars of the strategy. Affordability, lower crime rates, shorter commute times and higher homeownership rates allow Indianapolis to excel beyond its peers in placemaking.33 In terms of talent development and business advancement, though, Indianapolis contrasts poorly with its peers. Among 23 performance indicators that are tracked by the Indy Chamber for these two pillars, Indianapolis either lags three or all four peers for 17 of them.34,35 Among the five regions, Indianapolis scores better than fourth place in terms of net in-migration, poverty rate, venture capital, foreign exports per worker and completion of associate degrees and professional certifications.
Table 2 presents a comparative analysis of the trajectory of Indianapolis, its four peer regions and the United States since the Great Recession in terms of real gross domestic product (GDP), which is GDP that’s been adjusted for inflation. Divide total real GDP in a geographic area by its population to derive per capita real GDP. Per capita real GDP is the best-established index of economic development for a region. Divide real GDP by employment to get real labor productivity. Real labor productivity measures workforce quality and the earnings potential of jobs in a region. Growth in both must match other regions for a metropolitan area to preserve competitiveness.
Table 2: Comparison of Indianapolis metro economic performance with peer regions and the U.S., 2007-2021
| Indianapolis | Nashville | Denver | Charlotte | Columbus | Peer region average | United States | |
|---|---|---|---|---|---|---|---|
| Total growth | |||||||
| Real GDP | 18% | 59% | 43% | 38% | 33% | 44% | 26% |
| Employment | 14% | 32% | 22% | 22% | 15% | 23% | 6% |
| Population | 16% | 28% | 23% | 28% | 17% | 24% | 10% |
| Per capita real GDP | |||||||
| 2007 (% of Indy MSA) | - | 88% | 100% | 92% | 84% | 91% | 84% |
| 2021 (% of Indy MSA) | - | 108% | 115% | 99% | 95% | 104% | 94% |
| Growth | 1% | 24% | 17% | 8% | 14% | 16% | 14% |
| Real labor productivity | |||||||
| 2007 (% of Indy MSA) | - | 90% | 102% | 100% | 84% | 94% | 95% |
| 2021 (% of Indy MSA) | - | 106% | 115% | 109% | 95% | 106% | 109% |
| Growth | 3% | 20% | 17% | 13% | 16% | 17% | 18% |
Source: U.S. Bureau of Economic Analysis, real gross domestic product and population data; U.S. Bureau of Labor Statistics, Current Employment Statistics (CES) data, not seasonally adjusted
Between 2007 and 2021, per capita real GDP grew 16% in the average peer region and 14% nationwide, but only 1% in Indianapolis. During the same period, real labor productivity grew 19% in the average peer region and 18% nationwide, but only 3% in Indianapolis. With growth rates barely above zero, Indianapolis experienced little to no economic development or workforce advancement during a 14-year period.
Indianapolis missed the opportunity wave that significantly transformed the economies of other metropolitan areas. Despite anemic real productivity gains, employment in Indianapolis still grew 14%. This means job expansion in Indianapolis occurred primarily in low-paying occupations not tied to the most innovative sectors of the national economy.
Among peer regions, Nashville performed the best. Per capita real GDP in Nashville went from 88% of Indianapolis in 2007 to 108% of Indianapolis in 2021. Nashville’s total real GDP growth was more than triple that of Indianapolis. Visionary government and business leadership, bold investment in public assets, and a well-executed regional marketing strategy generated Nashville’s success.36
Indianapolis lags peers in growth of high-income jobs
A breakdown of comparative employment growth by industry sector and occupation offers more insight on the workforce standstill in Indianapolis since 2007 compared to peer regions. A dynamic region differentiates itself with exports to other regions of goods and services that are highly valued by markets and reflect the newest output of industry innovation.
Production of such goods and services requires highly skilled talent that sufficiently meets a need to fill new-generation occupations. Lack of high-skilled talent relegates job growth to industries and occupations linked to more mature parts of the economy. In these sectors, labor productivity and the wages paid workers are low. A region must continually incubate new innovation-intensive industry clusters to ensure market relevance, efficient specialization and high-reward jobs for its residents.
Table 2 reveals that average employment growth of 23% in peer regions between 2007 and 2021 was 64% higher than the 14% employment growth in Indianapolis. Table 3 disaggregates job growth between 2007 and 2021 by selected industry sectors. Financial activities; information; management of companies and enterprises; and professional, scientific, and technical services are high-income sectors that drive a disproportionate amount of GDP growth in any region. The 22% growth in Indianapolis was just about half of the average peer region growth of 42%, though it did exceed U.S. total growth of 14%.
Table 3: Comparison of Indianapolis metro job growth with peer regions and the U.S. in selected industry sectors, 2007-2021
| Industry sector | Indianapolis | Nashville | Denver | Charlotte | Columbus | Peer region average | United States |
|---|---|---|---|---|---|---|---|
| High-income sectors job growth | 22% | 71% | 34% | 42% | 20% | 42% | 14% |
| Financial activities | 13% | 49% | 16% | 34% | 16% | 29% | 5% |
| Information | -27% | 28% | 10% | 22% | -10% | 13% | -6% |
| Management of companies & enterprises | 1% | 176% | 53% | 49% | 46% | 81% | 27% |
| Professional, scientific & technical services | 58% | 94% | 61% | 61% | 21% | 59% | 29% |
| Job growth in other sectors | |||||||
| Administrative & support services | 25% | 42% | 6% | 28% | 11% | 22% | 8% |
| Durable goods | -18% | -3% | -6% | -13% | -17% | -10% | -13% |
| Federal government | 19% | 26% | 1% | 13% | 8% | 12% | 6% |
| Health care & social assistance | 44% | 37% | 51% | 34% | 46% | 42% | 28% |
| Leisure & hospitality | 3% | 28% | 15% | 21% | 7% | 18% | 5% |
| Local government | 3% | 17% | 15% | 16% | 4% | 13% | -3% |
| Natural resources, mining & construction | 4% | 21% | 17% | 0% | 14% | 13% | -4% |
| Non-durable goods | 4% | -4% | 5% | -2% | 10% | 2% | -8% |
| Retail trade | 0% | 11% | 7% | 15% | -4% | 7% | -2% |
| State government | 5% | -1% | 41% | 56% | 11% | 27% | 1% |
| Transportation, warehousing & utilities | 53% | 115% | 42% | 69% | 70% | 74% | 36% |
Source: U.S. Bureau of Labor Statistics, Current Employment Statistics (CES), not seasonally adjusted
In Indianapolis, jobs in information decreased by 27% and management of companies and enterprises grew only 1%. These compare with average growth of 13% and 81%, respectively, in peer regions. Even though Indianapolis is one of the most manufacturing-intensive regions in the country, its durable goods sector shrank 18% compared to 10% on average in other regions. Nashville enjoyed three times as much high-income sector job growth as Indianapolis. High-income sector job growth in Columbus trailed Indianapolis, reflecting, perhaps, that it faces similar structural challenges as a fellow Midwestern economy.
Table 1 suggests that the highest-growth occupations in Indianapolis do not earn workers the highest wage. Table 4 disaggregates job growth between 2007 and 2022 by selected occupational categories and presents data that strengthens this hypothesis. Architecture and engineering; business and financial operations; computer and mathematical; life, physical, and social science; and management are occupational categories that comprise the highest-income jobs. Growth in high-income occupations of 42% in Indianapolis was significantly short of the 72% growth in the average peer region and just short of the U.S. total growth of 50% over that period.
Table 4: Comparison of Indianapolis metro job growth with peer regions and the U.S. in selected occupational categories, 2007-2022
| Occupation category | Indianapolis | Nashville | Denver | Charlotte | Columbus | Peer region average | United States |
|---|---|---|---|---|---|---|---|
| High-income occupation job growth | 42% | 84% | 69% | 94% | 41% | 72% | 50% |
| Architecture & engineering | -10% | 13% | 36% | 34% | 4% | 22% | 0% |
| Business & financial operations | 63% | 124% | 103% | 107% | 50% | 96% | 61% |
| Computer & mathematical | 49% | 135% | 67% | 170% | 13% | 96% | 57% |
| Life, physical, & social science | -11% | 49% | 27% | 34% | -3% | 27% | 5% |
| Management | 50% | 63% | 52% | 72% | 81% | 67% | 64% |
| Job growth in other occupations | |||||||
| Arts, design, entertainment, sports, & media | 8% | 17% | 5% | 29% | 23% | 18% | 17% |
| Community & social service | 34% | 47% | 82% | 48% | 49% | 57% | 29% |
| Construction & extraction | -5% | 24% | 6% | 14% | 5% | 12% | -9% |
| Education, training, & library | 12% | 18% | 22% | 42% | 23% | 26% | 2% |
| Farming, fishing, & forestry | 6% | 133% | 167% | 3% | 10% | 78% | 3% |
| Food preparation & serving related | 17% | 33% | 32% | 52% | 6% | 31% | 11% |
| Healthcare practitioners & technical | 46% | 66% | 50% | 83% | 45% | 61% | 31% |
| Healthcare support | 98% | 80% | 112% | 101% | 54% | 87% | 87% |
| Installation, maintenance, & repair | 11% | 27% | 15% | 40% | 13% | 24% | 8% |
| Legal | 34% | 96% | 42% | 60% | 2% | 50% | 22% |
| Office & administrative support | -17% | 11% | -16% | 7% | -18% | -4% | -20% |
| Personal care & service | 2% | 34% | -2% | 36% | 4% | 18% | -15% |
| Production | 0% | -2% | -4% | 21% | -10% | 1% | -14% |
| Protective service | 25% | 48% | 21% | 36% | 18% | 31% | 11% |
| Sales & related | -1% | 10% | 15% | 30% | -11% | 11% | -8% |
| Transportation & material moving | 73% | 71% | 51% | 99% | 77% | 74% | 41% |
Source: U.S. Bureau of Labor Statistics, Occupational Employment and Wage Survey (OEWS)
In Indianapolis, architecture and engineering jobs decreased by 10% and science jobs decreased by 11%. This shrinkage occurred despite the region’s reputation for life sciences and its proximity to globally recognized engineering schools at Purdue University. In contrast, architecture and engineering jobs grew 22% and science jobs grew 27%, on average, in the peer regions.
High-income occupations expanded the most in Charlotte. Charlotte’s rate of expansion more than doubled that of Indianapolis, with outlier growth of 170% in computer and mathematical jobs and 107% in business and financial operations jobs. As with high-income sector job growth in Table 3, high-income occupation job growth in Columbus just lagged Indianapolis, further suggesting similar barriers to workforce development in both regions.
Indianapolis excels in availability of low-wage talent
The workforce trajectory of a region can be inferred by the relative wage of current jobs (job quality) and the volume of workers by occupation relative to what regional industry needs (workforce supply). Disproportionate employment in occupations that pay above the national average wage indicates a competitive workforce that generates value and innovation for the larger economy. Workers are sufficiently skilled and generously rewarded. They enable a region to compete and successfully connect itself to new dynamic markets. Workforce needs in terms of each occupation are defined by the industries in a region. When occupational employment in a region exceeds what industry-adjusted national patterns suggest, there is a supply of available workers that can drive future growth as local companies invest in their own productivity improvements.
Applying these concepts, the competitive position of a region can be mapped in two-dimensional space, or a quadrant, with workforce supply X on the horizontal axis and job quality Y on the vertical axis. Workforce supply X measures employment as a percent of what the regional industry structure needs based upon national production patterns. See Appendix 1 for mathematical detail on the derivation and calculation of X. A value of X greater than one means workers are available to drive further growth if local industries adopt methods, processes and technologies that elevate labor productivity to nationally comparative levels.
Job quality Y is the average hourly wage paid in the region as a percentage of the average hourly wage earned by a worker in the United States. A value of Y greater than one suggests that comparatively high-paying jobs drive regional employment growth. A value of Y less than one suggests that comparatively low-paying jobs drive regional employment growth.
Figure 1 illustrates how a region’s labor force can fall into one of four quadrants. Along the vertical axis, X = 1, which means the workforce supply exactly meets need given the region’s industry structure and national production patterns in those industries. Along the horizontal axis, Y = 1, which means workers in the region on average are paid the mean hourly national wage. A region at the origin (X,Y) = (1,1) has a workforce that is paid the national average and exactly meets the talent demand of regional industries.
Regions above the horizontal axis (where Y > 1) are in a better long-term position. Growth in these regions occurs through higher-quality jobs which keep household income above the national average. These regions have a competitive advantage in attracting and retaining talent. If X > 1, then the region is “advancing” because there already exists a pool of high-quality talent to drive growth as local industries invest in higher productivity operations. If X < 1, then the region is “high-potential” because it has a high-quality job base but a workforce supply that still needs to be recruited.
Regions below the horizontal axis (where Y < 1) are in a worrisome long-term position. These regional economies are built upon low-paying jobs. Because economic expansion does not occur through comparatively high-quality jobs, growth strengthens the relatively low-income position of these regions. Bringing high-quality jobs to these regions is difficult because the skills of the existing workforce must improve and better educated workers must move to the region. Additionally, the mix of employers must value better talent and be willing to pay higher wages. Structural transformation of both hiring patterns and the talent available must occur to lift a region above the horizontal axis.
A region below the horizontal axis with X > 1 is “lagging”. The region has talent to fuel further economic expansion as local industries invest in higher productivity operations, but because lower-paying occupations dominate the workforce, such expansion represents growth in sectors that are secondary to the national value chain. Compared to other metropolitan areas, the region is less relevant as a driver of national prosperity. A region below the horizontal axis with X < 1 is “deteriorating” and in the worst possible economic position. Not only are jobs of low quality, but the region is short of potential talent to drive future growth. In such regions, the dominance and persistence of low-income opportunities leads to depopulation, which fuels a negative spiral of worsening stagnation that is difficult to reverse.
Figure 1: Job quality and labor supply quadrant with the five peer metros
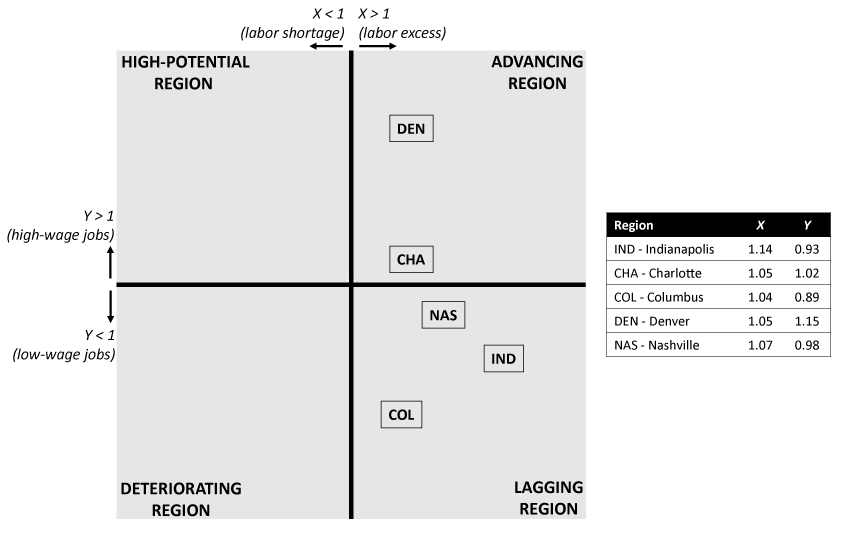
Source: Authors’ calculations from U.S. Bureau of Labor Statistics and U.S. Bureau of Economic Analysis data
We used data from the U.S. Bureaus of Labor Statistics and Economic Analysis to estimate X and Y for Indianapolis and its four peer regions. The relative position of each region is highlighted in Figure 1. Denver has the strongest workforce base with an average hourly wage 15% above the national average. Additionally, with a 5% workforce supply cushion, Denver is the most “advancing region” among the five compared. Indianapolis has the second-weakest workforce base with an average hourly wage 7% below the national average. This result is consistent with previously shared data.
Indianapolis, though, stands out with the highest workforce supply cushion, at 14%. This suggests Indianapolis thrives comparatively in attracting workers, but it attracts workers that fill jobs which pay measurably lower than other regions. In contrast to Intel’s upcoming investment of $20 billion in new chip manufacturing capacity in central Ohio,37 Columbus faces the biggest workforce challenge among the five regions with hourly wages 11% below the national average and excess workers of only 4%. The Intel announcement, though, is exactly what Columbus needs to rise vertically in Figure 1 and permanently strengthen the workforce base. Similarly big corporate investments lifted the workforce base of Nashville over time and continue to give it momentum.38
A comprehensive effort to raise productivity can lift the Indianapolis workforce
The Indianapolis economy is built upon low-paying jobs, the wages for which fall further and further behind the national average. As previously stated, between 2007 and 2021, real labor productivity increased only 3% in the Indianapolis metro versus 18% nationwide. This translated into only 1% growth in real per capita GDP versus 14% nationally over the 14-year period. Despite expansion in this income gap, Indianapolis employment grew 14% as opposed to 6% nationally. At least now, Indianapolis remains surprisingly resilient in its ability to attract workers. The region enjoys a workforce supply 14% greater than what regional industry needs based upon national production patterns. This speaks to comparatively high rankings for Indianapolis in terms of affordability and livability.39
While affordability can compensate for relatively low wages in the short run, Indianapolis cannot compete for talent in the long run if real labor productivity continues to grow six times faster nationally than in the region. Failure to reverse the region’s comparative productivity slide will permanently relegate Indianapolis to the periphery of national prosperity. Business, government and education must jointly execute a well-planned and well-coordinated, multi-pronged strategy to raise regional productivity.
Incoming and existing members of the Indianapolis workforce must be quickly upskilled, especially in industries that are major drivers of the Indianapolis economy, such as manufacturing, logistics, health care, life sciences and technology. The journey from middle school through high school and postsecondary training and onto a first career-based job should be smoothed. Transitions between educational institutions and then into industry can be easier for students.
New initiatives that are underway – such as automatic enrollment of qualifying students in the 21st Century Scholars Program, funding of Career Scholarship Accounts to encourage career-oriented employment during high school and development of the Modern Apprenticeship Program – accomplish these ends. The dissolution of IUPUI motivates Indiana University (IU) and Purdue University (PU) to make a bachelor’s degree more accessible and economically relevant for the Indianapolis workforce. Easier academic transfer from Ivy Tech after earning an associate degree, broader adoption of cooperative education curricula (like that found at Northeastern University and the University of Cincinnati) and launch of new industry-relevant micro-credentials40 are well-proven opportunities both universities can pursue.
Successful integration of learning, training and work requires profitable absorption of inexperienced interns and apprentices by employers. This can be prohibitively disruptive, especially for medium- and small-sized businesses with thin profit margins, scarce management capacity and limited experience in hiring young or transitioning workers. Programs designed to upskill workers must budget adequate resources to incentivize and administratively support successful participation by diverse sets of hiring organizations.
Innovative management models, new technology and modern plant and equipment can lift labor productivity as much as training and education. By itself, better machinery increases what a worker can produce in an hour. Even though talent is the new priority for economic development, old-style work by state and local government to recruit new and retain established companies remains important for regional productivity growth. Elanco’s new global headquarters in the southwest quadrant of downtown,41 Andretti Global’s new operations hub in the airport area42 and Eli Lilly’s new research and manufacturing campus in Boone County43 are examples of incoming corporate investment in modern fixed assets that increase worker productivity in the Indianapolis region.
Beyond investments, discovery and transfer of new knowledge combined with tighter industry networks can strengthen the competitiveness of economic clusters and the value their workforces produce. Comparably, Indianapolis remains a hub of research and development. For example, Indianapolis generates utility patents at three times the rate of Nashville, even though Nashville’s rate of real GDP growth significantly exceeds that of Indianapolis.44
Expansion of research by IU and PU on their Indianapolis campuses and geographic manifestation of it within the 16 Tech innovation district can enrich this regional competitive advantage and initiate fresh waves of intellectual property that fuel new inventions, products and entrepreneurial ventures. This presents opportunity for the Central Indiana Corporate Partnership (serendipitously located at 16 Tech) to deepen its role as a regional convenor of thought leadership, business collaboration and investment for the industries that drive the Indianapolis economy. Large corporate investment in new fixed assets, broadened intellectual discovery and stronger industry ecosystems powerfully complement the positive impact of better education and training on labor productivity.
Motivating highly educated professionals to move to Indianapolis and fill high-paid job vacancies is a straightforward way to increase regional wages and productivity. In general, the migration of new skilled talent to central Indiana is a hard outcome to achieve; hundreds of other regions are competing for the same talent. The Indianapolis region, though, is annually blessed with tens of thousands of out-of-state students enrolled at IU, PU, Ball State, Butler, Marian, UIndy and other universities within 100 miles of downtown. Since 61% of university graduates prefer to work close to their alma mater,45 extraordinary investment in matching these students to a first career job in Indianapolis can have a very high return.
Simply increasing student awareness of internship and job opportunities in Indianapolis, especially with small-and medium-sized enterprises, can be effective in convincing graduates to join the regional workforce. University integration of academic programming with industry-talent pipelines, creative placemaking for young professionals and geographic concentration of entrepreneurial activity are additional ways to retain graduates in the Indianapolis region.
Better health, and more affordable health care, also increases labor productivity. Less chronic disease lowers medical insurance premiums, fewer sick days increase time on the job and improved mental health elevates employee engagement. These positive changes raise the output and reduce the cost of a worker. An overall health ranking of 35 out of 50 states for Indiana suggests policymakers can make improvements that will increase worker productivity.46
A 1,500-percent increase in public health spending approved by the 2023 General Assembly was a good start.47 Additionally, in response to Indiana having the seventh-highest relative health care costs in the nation,48 the General Assembly has taken action to regulate the oligopoly pricing power of providers. This includes new transparency requirements for billing based on location of medical services received and restriction of non-compete agreements for physicians.49,50 Given that medical insurance comprises such a large share of both employee compensation and household income, efforts to reduce health care costs can increase the dollar value of labor expense and measurably boost productivity.
Overall, the data reveals a shocking slide in the relative economic position of Indianapolis since the Great Recession. The share of the workforce employed in high-paying occupations in dynamic industries has increased in peer regions while it has fallen in Indianapolis. Failure to reverse this slide can condemn Indianapolis to a geographical poverty trap that is difficult to reverse. Business, government and education must adopt a sense of urgency and intervene to accelerate increases in labor productivity.
Effort must simultaneously prepare students and upskill workers for higher-wage jobs, secure new corporate investment in fixed assets, expand economically relevant research and development, strengthen industry ecosystems, retain more out-of-state students who graduate from regional universities and reduce the cost of employee health care. Recent legislation and regional initiatives currently give this work momentum in Indianapolis. Regional leaders, though, must double down on innovative solutions that bring a market renaissance to Indianapolis, one that allows it to enter the same economic takeoff enjoyed by peer regions.
Appendix 1
Job quality and labor supply quadrant with the five peer metros
The competitive position of a region can be mapped in two-dimensional space with workforce supply X on the horizontal axis and job quality Y on the vertical axis. Workforce supply X measures employment as a percent of what the regional industry structure needs based upon national production patterns. The mathematical detail on the derivation and calculation of X follows here:
Assume a vector y of national GDP produced by industries j = 1, 2, …, m such that national GDP Y is:

Assume a vector zj of observed national employment across occupations i = 1, 2, …, n in industry j.
Divide each element of zj by yj to generate column vector aj such that:
Where aji is the employment in occupation i needed to produce $1 of national GDP in industry j.
Let A be an n x m matrix of aji across occupations i = 1, 2, …, n and industries j = 1, 2, …, m such that:

Assume a row vector yh of regional GDP for region h produced by industries j = 1, 2, …, m such that regional GDP Yh is:

Assume a vector zhi of observed total regional employment across occupations i = 1, 2, …, n such that total regional employment Zh is:

Multiply A (an n x m matrix) by yh (an m x 1 vector) to derive vector rh (an n x 1 vector) such that:
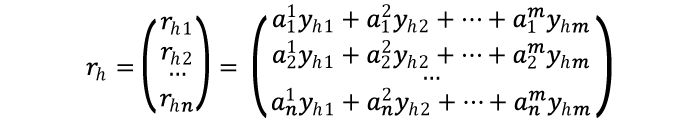
where rhi is the theoretically needed volume of zhi to produce Yh based upon the observed industry profile of region h and national occupational ratios for those industries.
For each occupation i in region h, let xhi be the ratio of observed employment zhi to theoretically needed employment rhi so that:

The variable xhi acts as normalized regional measure of workforce supply for occupation i adjusted for the observed industry profile for region h. If xhi equals one, then observed employment in occupation i exactly matches what national patterns would predict for the industry profile observed in region h. If xhi is less than one, then observed employment in occupation i is less than theoretically needed to produce Yh. If xhi is greater than one, then observed employment in occupation i is more than theoretically needed to produce Yh.
Let μhi be the regional employment share of occupation i so that:

For region h, define X as average normalized workforce supply weighted by occupational workforce share so that:

The variable X acts as normalized regional measure of total workforce supply adjusted for the observed industry profile for region h. If X equals one, then observed total employment exactly matches what national patterns would predict for the industry profile observed in region h. If X is less than one, then observed total employment is less than theoretically needed to produce Yh. If X is greater than one, then observed total employment is more than theoretically needed to produce Yh.
Notes
- Avery, Christina. 2023. “Indiana’s new flexible ‘scholarship accounts’ for career education divide opinion.” Indianapolis Business Journal, May 23, 2023. https://www.ibj.com/articles/indianas-new-flexible-scholarship-accounts-for-career-education-divide-opinion.
- Carden, Dan. 2023. “House OKs automatic enrollment in Indiana’s 21st Century Scholars Program.” The Times of Northwest Indiana. May 10, 2023. https://www.nwitimes.com/news/local/education/house-oks-automatic-enrollment-in-indianas-21st-century-scholars-program/article_ed036149-265e-56b6-ba28-50cedb6fe67c.html.
- Bradley, Daniel. 2023. “Central Indiana mayors discuss how region can compete through cooperation.” Indianapolis Business Journal. April 27, 2023. https://www.ibj.com/articles/indy-area-mayors-discuss-how-region-can-compete-and-succeed.
- Tuohy, John. 2021. “White River coalition gets $20M of $50M requested. Now it must decide what projects to cut.” Indianapolis Star. December 17, 2021. https://www.indystar.com/story/news/local/hamilton-county/2021/12/17/indiana-white-river-upgrades-50-m-sought-20-m-approved-whats-cut-marion-hamilton-madison-county/8910239002/.
- White River Regional Opportunity Initiative. 2021. “Regional Development Plan.” https://www.discoverwhiteriver.com/wp-content/uploads/2021/10/WR-ROI-report.pdf.
- Feltman, Nate. 2023. “Nate Feltman: IUPUI split will be key to downtown’s future.” Indianapolis Business Journal. February 17, 2023. https://www.ibj.com/articles/nate-feltman-iupui-split-will-be-key-to-downtowns-future.
- Ascend Indiana. 2022. “Ascend Indiana and EmployIndy receive a $6 million grant to scale Modern Youth Apprenticeship for high school students in Central Indiana.” June 28, 2022. https://ascendindiana.com/news/ascend-indiana-and-employindy-receive-a-6-million-grant-to-scale-modern-youth-apprenticeship-for-high-school-students-in-central-indiana.
- Indy Chamber. 2023. Leadership Exchange Switzerland. https://www.lexindy.com/.
- Florida, Richard. 2019. The Rise of the Creative Class. New York: Basic Books.
- Gittell, Ross, Jeffrey Sohl, and Edinaldo Tebaldi. 2014. “Do entrepreneurship and high-tech concentration create jobs? Exploring the growth in employment in U.S. metropolitan areas from 1991 to 2007.” Economic Development Quarterly 28(3): 244-253. https://journals.sagepub.com/doi/full/10.1177/0891242414530467.
- Adams, Stephen B. 2021. “From orchards to chips: Silicon Valley’s evolving entrepreneurial ecosystem.” Entrepreneurship & Regional Development 33(1-2): 15-35. https://www.tandfonline.com/doi/abs/10.1080/08985626.2020.1734259.
- Rosen, Sherwin. 1993. “The decline of the Midwest.” The Quarterly Review of Economics and Finance 33(1): 1-14.
- Kesteven, Charlotte, Alissa Dubetz, Abraham Song, and Caroline Choi. 2022. Best-Performing Cities 2022: Charting Economic Resilience and Opportunity. Santa Monica: Milken Institute. https://milkeninstitute.org/sites/default/files/2022-03/Best-Performing%20Cities%20US%202022.pdf.
- Harvard University Equality of Opportunity Project. 2014. “Where is the Land of Opportunity? The Geography of Intergenerational Mobility in the United States.” Online Data Table 4, http://www.equality-of-opportunity.org/data/.
- McCann, Adam. 2023. “2023’s Most & Least Educated Cities in America.” July 17, 2023. WalletHub. https://wallethub.com/edu/e/most-and-least-educated-cities/6656.
- Shearer, Chad, Isha Shah, Mark Muro. 2018. Advancing Opportunity in Central Indiana. December 2018. Washington: Metropolitan Policy Program, The Brookings Institution. https://www.brookings.edu/wp-content/uploads/2018/12/2018.15_BrookingsMetro_Indy-Opportunity-Industries_Report_Shearer-Shah-Muro.pdf.
- Federal Reserve Bank of St. Louis. 2023. Average Hourly Earnings of All Employees: Total Private in Indianapolis-Carmel-Anderson (MSA). Federal Reserve Economic Database (FRED). https://fred.stlouisfed.org/series/SMU18269000500000003.
- Federal Reserve Bank of St. Louis. 2023. Average Hourly Earnings of All Employees: Total Private. Federal Reserve Economic Database (FRED). https://fred.stlouisfed.org/series/CES0500000003.
- Ascend Indiana and EmployIndy. 2022. Indiana’s Evolving Labor Market: How the Pandemic Has Accelerated Misalignment in Talent Supply and Demand. November 3, 2022. Indianapolis: Ascend Indiana and EmployIndy. https://ascendindiana.com/resources/indianas-evolving-labor-market-full-report-2022-2.
- U.S. Bureau of Economic Analysis. 2023. Regional Data: GDP and Personal Income. https://apps.bea.gov/itable/?ReqID=70&step=1. Indianapolis metropolitan area GDP was $162.1 billion in 2021, which was 39% of Indiana’s GDP of $413.0 billion. Indianapolis metropolitan area personal income was $140.0 billion in 2021, which was 36% of Indiana’s total personal income of $384.5 billion.
- STATS Indiana and the Indiana Department of Workforce Development. 2023. “Indianapolis-Carmel-Anderson, IN Metro Area.” Hoosiers by the Numbers. IN Depth Regional Profile. https://www.hoosierdata.in.gov/profiles.asp?scope_choice=b&county_changer2=Rmetro:26900&id=2&page_path=Area+Profiles&path_id=11&menu_level=smenu1&panel_number=1.
- Federal Reserve Bank of St. Louis. 2023. Civilian Labor Force in Indianapolis-Carmel-Anderson, IN (MSA). Annual Average. Federal Reserve Economic Database (FRED). https://fred.stlouisfed.org/series/INDI918LFN.
- Federal Reserve Bank of St. Louis. 2023. Civilian Labor Force in Indiana. Annual Average. Federal Reserve Economic Database (FRED). https://fred.stlouisfed.org/series/INLF#0.
- Federal Reserve Bank of St. Louis. 2023. Unemployment Rate in Indianapolis-Carmel-Anderson, IN (MSA). Annual Average. Federal Reserve Economic Database (FRED). https://fred.stlouisfed.org/series/INDI918URN.
- Federal Reserve Bank of St. Louis. 2023. Unemployment Rate in Indiana. Annual Average. Federal Reserve Economic Database (FRED). https://fred.stlouisfed.org/series/INUR.
- Federal Reserve Bank of St. Louis. 2023. Average Hourly Earnings of All Employees: Total Private in Indianapolis-Carmel-Anderson (MSA). Annual Average. Federal Reserve Economic Database (FRED). https://fred.stlouisfed.org/series/SMU18269000500000003#0.
- Federal Reserve Bank of St. Louis. 2023. Average Hourly Earnings of All Employees: Total Private in Indiana. Annual Average. Federal Reserve Economic Database (FRED). https://fred.stlouisfed.org/series/SMU18000000500000003A.
- Bureau of Labor Statistics. 2022. “Indianapolis-Carmel-Anderson, IN.” May 2022 Metropolitan and Nonmetropolitan Area Occupational Employment and Wage Estimates. https://www.bls.gov/oes/current/oes_26900.htm.
- Bureau of Labor Statistics. 2022. “Indiana.” May 2022 State Occupational Employment and Wage Estimates. https://www.bls.gov/oes/current/oes_in.htm.
- Accredited Schools Online. 2022. Colleges, Universities and Online Colleges in Indianapolis. November 2, 2022. https://www.accreditedschoolsonline.org/indiana/indianapolis-in/.
- Gayán-Navarro, Carlos, Marcos Sanso-Navarro, and Fernando Sanz-Gracia. 2020. “An assessment of poverty determinants in U.S. census tracts, 1970-2010.” Growth and Change 51(3): 977-999.
- Indy Chamber. 2023. Accelerate Indy: Accelerate Indy for All. https://indychamber.com/accelerate-indy/.
- Indy Chamber. 2023. “Place Dashboard.” Accelerate Indy: Accelerate Indy for All. https://cdn.kicksdigital.com/indychamber.com/2023/05/Place-Dashboard.pdf.
- Indy Chamber. 2023. “Talent Dashboard.” Accelerate Indy: Accelerate Indy for All. https://cdn.kicksdigital.com/indychamber.com/2023/05/Talent-Dashboard.pdf.
- Indy Chamber. 2023. “Business Dashboard.” Accelerate Indy: Accelerate Indy for All. https://cdn.kicksdigital.com/indychamber.com/2023/05/Business-Dashboard.pdf.
- Powell, Philip T., Timothy F. Slaper, and Carol O. Rogers. 2023. “Music City and the Circle City: Lessons for regional economic development strategy.” Indiana Business Review 98(1). https://www.ibrc.indiana.edu/ibr/2023/spring/article1.html.
- Heater, Brian. 2022. “Why Intel chose Columbus, Ohio to build chips.” TechCrunch. June 1, 2022. https://techcrunch.com/2022/06/01/how-intel-landed-in-columbus/.
- Powell et al., Ibid.
- MoneyGeek. 2023. “10 Best Big Cities for Affordable Living.” April 2, 2023. https://www.moneygeek.com/living/best-big-cities-for-making-a-living/.
- Varadarajan, Soovendran, Joyce Hwee Ling Koh, and Ben Kei Daniel. 2023. “A systematic review of the opportunities and challenges of micro-credentials for multiple stakeholders: learners, employers, higher education institutions and government.” International Journal of Educational Technology and Higher Education 20(13). https://educationaltechnologyjournal.springeropen.com/articles/10.1186/s41239-023-00381-x.
- Shuey, Mickey. 2020. “Elanco HQ: How the deal was done.” The Daily Reporter. December 12, 2020. https://www.greenfieldreporter.com/2020/12/12/elanco_hq_how_the_deal_was_done/.
- Malsher-Lopez, David. 2022. “Andretti to build new motorsport headquarters in Indiana.” Autosport. August 22, 2022. https://www.autosport.com/indycar/news/andretti-to-build-new-motorsport-headquarters-in-indiana/10356405/.
- Rafford, Claire. 2023. “Lilly adds another $1.6B, 200 jobs to Boone County project.” Indianapolis Star. April 17, 2023. https://www.indystar.com/story/news/local/indianapolis/2023/04/17/lilly-adds-1-6b-200-jobs-to-boone-county-project/70122119007/.
- Powell et al., Ibid.
- Tallo. 2022. “Where do students want to live after graduation?” May 10, 2022. https://tallo.com/data-insights/where-high-school-college-students-live-after-graduation/.
- United Health Foundation and American Public Health Association. 2023. “America’s Health Rankings Annual Report 2022.” AmericasHealthRankings.org. https://assets.americashealthrankings.org/app/uploads/ahr_2022annualreport.pdf.
- Messerly, Megan. 2023. “A red state boosted public health funding by 1,500 percent. This is how they did it.” Politico. July 13, 2023. https://www.politico.com/news/2023/07/13/red-state-public-health-funding-indiana-00105982.
- Whaley, Christopher M., Brian Briscombe, Rose Kerber, Brenna O'Neill, and Aaron Kofner. 2022. Prices Paid to Hospitals by Private Health Plans: Findings from Round 4 of an Employer-Led Transparency Initiative. Santa Monica, CA: RAND Corporation. https://www.rand.org/pubs/research_reports/RRA1144-1.html.
- Katebi, Charlie. 2023. “Hoosier savings: Indiana leads the way in tackling health-care costs.” City Journal. May 16, 2023. New York: Manhattan Institute. https://www.city-journal.org/article/indiana-leads-the-way-on-health-care-costs.
- Downard, Whitney. 2023. “Physician non competes, unlawful tracking heading for governor’s desk.” Indiana Capital Chronicle. April 25, 2023. https://indianacapitalchronicle.com/2023/04/25/physician-non-competes-unlawful-tracking-heading-for-governors-desk/.
