Double Duty: Career Tool for Job Seekers, Labor Supply Tool for Economic Developers
Director of Economic Analysis, Indiana Business Research Center, Indiana University Kelley School of Business
Deputy Director, Indiana Business Research Center, Indiana University Kelley School of Business
A new career pathway tool is available on the Hoosiers by the Numbers labor market information website (www.hoosierdata.in.gov). Called the Virtual Career Counselor (VCC), it is an interactive tool that allows users—a job-seeker or a workforce career counselor, for example—to estimate the needed preparation time to transition from one occupation to another.
The preparation time—measured in weeks of academic, technical or vocational training—is a relative measure estimating the ease or difficulty of moving from one type of job to another.
This article goes beyond the job seeker’s perspective, however, to show how these data can be used in the economic development community to determine how difficult it would be to close a region’s skills gap for an occupation or a category of occupations relative to a benchmark region.
The database underlying the VCC reports the knowledge, skills and training required for each of the approximately 800 standardized occupations classified by the federal government. The calculations compare the similarity of education, skills and training between occupations and estimate the additional amount of education or training one would need to move from one occupation to another.
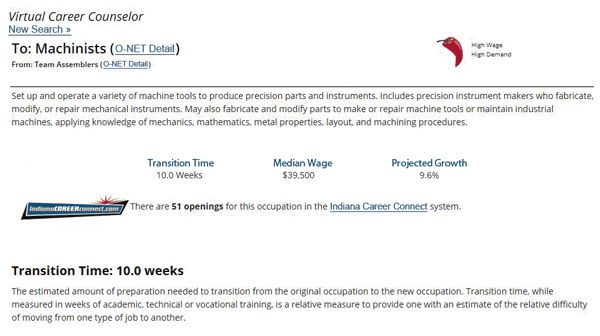
In other words, the VCC addresses the questions of how long and how difficult the transition will be from an “originating” occupation to a “destination” occupation (see Figure 1). The algorithm estimates the gap or distance based on the knowledge, skills and training requirements for each occupation (the “from” and the “to”).1
Figure 1: From Team Assembler to Machinist using the Virtual Career Counselor
Source: Hoosiers by the Numbers
The goal of the Indiana Business Research Center (IBRC) and Department of Workforce Development (DWD) team was to boil down the complex components of an occupation’s knowledge and skill requirements. To move from one occupation to another, a worker in transition would likely need additional training, education or even an apprenticeship. Those take time. So, the team compared the knowledge, skills and training (KST) for an originating occupation and a destination occupation. The differences in the two KSTs were distilled down to one dimension: time. This time dimension can inform a worker’s decision about which destination occupation would fit with his or her time and financial resources.
Put another way, time is the dimension on which to measure a skills gap, the length of the journey to move from occupation A to occupation B. There are many other considerations, of course. A path that means paying large sums for tuition would not be feasible for many. Many would rule out a path requiring in-residence course work far away from home. But transition time can represent the difference between working in one occupation and migrating to another.
The team followed other models that also use time as the primary gap-closing measure. O*NET, for example, surveys incumbent workers to determine, among many things, the level of proficiency necessary for a wide range of worker and job characteristics and the educational and training time it would take for an individual to become proficient at a particular job. O*NET rates each proficiency level; the research team estimated the extent to which each proficiency level requires more time in terms of education and training.
The researchers found that as one moved through the O*NET proficiency levels, the estimated time required to complete each increased substantially with each step. The difference in training to move from Level 1 to Level 2, for example, was less than a week—notably less than the gap between a Level 5 and a Level 6, which was an average of 7 weeks. The O*NET scale, therefore, was not linear.
The research team sought to simplify the methodology, and making the measurements simple came at the cost of some precision. For example, the estimated time required for education and training were made consistent across different mechanisms for knowledge or skills development—academic, vocational or apprenticeships. An hour in a college classroom is different from an hour in a vocational training laboratory, but both represent a time investment by the worker and are expressed in the transition-time calculation.
It is important to stress that the time measure indicates the relative ease or difficulty of moving from one occupation to another, and one might consider the time measure to be “on average.” After all, the time to complete a class or training may be dependent on when a course starts or if the training is conducted on a compressed time schedule. There is no accounting for “intensive training.”
The team also adjusted the O*NET time dimension based on the fact that gaining skills and training in one knowledge area enhances one’s skills in another knowledge area. One might call this “overlap” in educational pursuit. Students often gain knowledge and skills in tandem; not all knowledge is gained sequentially. For example, as one pursues education in physics, he also develops knowledge in the highly correlated knowledge area of mathematics as well. As one learns to operate specialized machines, she is also gaining experience in instruments and monitoring production processes. In other words, the body of coursework or training is not necessarily sequential or additive. Analysts added only the non-overlapping portions of additional training time to derive the transition time.
In order to cross-check the transition-time estimates, the team also compared the transition- time results with the O*NET job zone framework. O*NET groups occupations into job zones based on their required levels of formal education, experience and on-the-job training. In all, there are five zones, with Zone 1 occupations requiring little or no preparation and Zone 5 occupations needing extensive preparation. Generally speaking, moving up a job zone will require more time than stepping down to a lower job zone.
Examples from the Virtual Career Counselor
The Virtual Career Counselor on the Hoosiers by the Numbers website is applicable to all occupations and puts the transition-time research into practice.
A displaced worker would likely entertain several options before committing to an educational or re-training program. Some workers may prefer transitions with the shortest transition time in order to adopt new career opportunities as quickly as possible.
For example, the most common job among automotive workers is team assembler. If a team assembler was interested in a higher-wage/higher-demand job, he or she could transition to a hazardous materials removal worker with approximately eight weeks of training time. He or she could transition to an insulation worker with only five weeks of training time.
Production helper is another auto-sector occupation in decline. On average, these workers can make relatively fast transitions to construction laborers.
Transition Time and Labor Shed Analysis
The transition-time method is groundbreaking because it compresses all of the differences between occupations into a common numéraire, namely the preparation or re-training time it would take to change jobs. It is alleged that the American labor force is suffering from a “skills gap,” or a mismatch between the knowledge, skills and training (KST) of the labor supply and the KST demanded by firms. In the main, the skills gap is a knowledge or human capital gap and, as described above, the transition time measures that gap. In other words, the transition-time framework embodies all of the occupational dimensions of a job ranging from knowledge content to problem solving to the ability to work as a team member.
The IBRC analysts applied the KST information for each occupation (used by the transition-time framework) to measure the relative concentration of KSTs in a region in much the same way that a location quotient (LQ) measures the relative concentration of industry or occupations in a region. One might say that this analysis presents LQs in terms of how difficult it would be to close a region’s KST gap for an occupation or a category of occupations, at least relative to a benchmark region or the nation as a whole.
Data Sources and Method
The occupation data for the regional Indiana analysis were pulled from the Hoosier by the Numbers “Regional Labor Mix” (RLM) tool. The RLM presents county-level data on industry employment by detailed NAICS industry as well as occupation counts by detailed occupation titles for the state (with the proviso that the total employment for all counties presented must exceed 25,000). The transition-time estimates for moving from one occupation to another are also available on the Hoosier by the Numbers website. The KST data used to estimate transition time were taken from the national database of occupation characteristics compiled by O*NET.
An occupation’s KST level is the average of all the transition times for all occupations moving to a target destination occupation. For example, the KST level for a dishwasher is very low while the KST for a neurosurgeon is quite high. The KST value for any occupation is constant; it does not vary according to whether a region is in Indiana or elsewhere in the nation. The occupation skills gap, or KST gap, was calculated by multiplying the percent of the region’s workforce associated with an occupation by the occupation’s KST level. The KST gap is, therefore, a concentration measure of the deficit or surplus of a region’s KST for an occupation or category of occupations. The KST gap for a region can be compared to another peer region, the state or the nation as a whole.
Occupational Clusters:
A Brief Excursus
In 2009, the IBRC and the Purdue Center for Regional Development (PCRD) published papers on innovation, occupation and industry clusters and created a website to provide data on how these data and concepts are important for economic development practitioners. The PCRD defined “knowledge-based clusters” based on the relative level and importance of knowledge fooccupation—knowledge being a critical element for innovation-based economic growth. In 2014, the IBRC updated the knowledge-based clusters (to conform to new O*NET vintages of occupation definitions) and extended this analysis to include what is here called “skill-based clusters” of occupations. The new IBRC occupation clusters cover the waterfront, with all occupations included. The 34 new clusters are used in this analysis and available in the appendix.
Applying the KST Gap to North Central and Central Indiana
The KST gap provides a measure of the level of difficulty to build a region’s KST for an industry that uses certain critical occupations. In the following example, the KST gaps were calculated for the North Central Indiana region of Cass, Clinton, Fulton, Howard, Miami and Tipton counties and the Indianapolis-Carmel Metropolitan Statistical Area (MSA). Because occupations are “counted” in the county where the firm operates—that is, occupation by industry—the actual number of any particular occupation within the boundaries of a region depends on the extent of commuting from areas outside the region under study. For example, the North Central region registers a fairly high concentration of engineers, but they may live in Lafayette or in Carmel.
The KST analysis has both strengths and weaknesses. The method and data can provide a quick assessment of which occupations, and their associated KST sets, will be more difficult for a region to develop or “sell” to a prospective firm interested in establishing a new business location. The measure cannot identify specific skills—for example, complex problem solving or C++ programming capabilities—that may be strengths or weaknesses in a region. The measure also does not take into consideration the persistence of the KST concentration. A region may have a super-endowment of CNC machinists, but they may be close to retirement. Average worker age is not (at least not yet) taken into account.
The inconsistency of SOC codes used to classify occupations has caused some issues because of time-lags in application of revisions to actual data publication. These inconsistencies play out in another caveat: one can only compare occupations, and occupation codes, for which data are collected. If data are collected and reported using different classification vintages, it makes it a challenge to ensure that 100 percent of a category of occupations—for example, health care practitioners—in the study region consist of the same occupations in a peer region.
The good news for Indiana Regional Labor Mix customers is that the IBRC has a consistent set of occupations for any one year and IBRC occupation estimates are more comprehensive, occupational-mix-speaking, than many of the Bureau of Labor Statistics (BLS) data products for smaller regions. The IBRC occupation estimates are a hybrid of national staffing patterns—which means there is a more diverse and comprehensive array of occupations for any geographical boundary—and BLS/DWD regional Occupational Employment Statistics (OES) estimates that provide regional characteristics of the local industry staffing patterns. The end result is a set of industry staffing patterns that were sketched-out using national estimates and refined by regional characteristics.
Finally, many O*NET occupation characteristics, as in the skills needed for an occupation, cannot be changed by legislative fiat. Necessary skills like “life skills” may or may not be amendable to changes in public school curriculum or community college programs of study. This raises the question: What is a skill? Is a skill a subject in school? Are skills inculcated by a family? Are skills developed by social interactions during club soccer? Can reasonable people agree on a definition?
All this to say, many workforce “skill” measurements are lacking. In several studies about the so-called skills gap,2 managers pointed to life skills as the most important determinant in hiring. This would jibe with the authors’ conversations with businesses and employers around the state about the most critical skills employers need: workers that show up on time and can pass a drug test.
After all those provisos and caveats, it may be a wonder that the reader has not “changed the channel.” But consider the power of one simple measure to assess the level of difficulty to build a region’s knowledge, skills and training for any particular application. The method and data can provide a quick assessment of which occupations, and their associated KST sets, will be more difficult for a region to develop or “sell” to a prospective firm interested in establishing a new business location.
The example below, using the six-county region of North Central Indiana, shows the difference between a region’s labor concentration using standard LQs and that of the KST concentration using the new IBRC occupation cluster definitions. Figure 2 presents standard LQs with knowledge-based occupations. Figure 3 presents standard LQs with skill-based occupations.
Figures 2 and 3 show that the region has particular strengths in engineering as well as STEM and applied technology on the knowledge-based side of the ledger, complementing the machinists and other production occupations that are also in abundance in the region.
Figure 2: North Central Indiana Location Quotients for Knowledge-Based Occupations, 2012
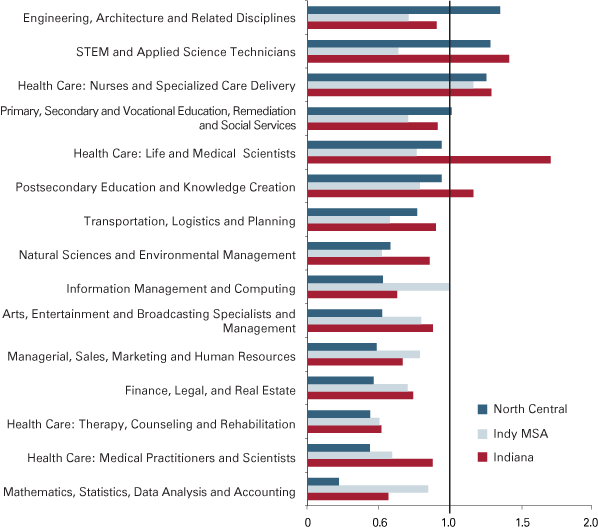
Note: An LQ of 1 shows an employment concentration equal to the nation. Clusters are sorted based on the North Central LQ.
Source: IBRC estimates using Quarterly Survey of Employment and Wages and Occupation Employment Survey data from the BLS
Figure 3: North Central Indiana Location Quotients for Skill-Based Occupations, 2012
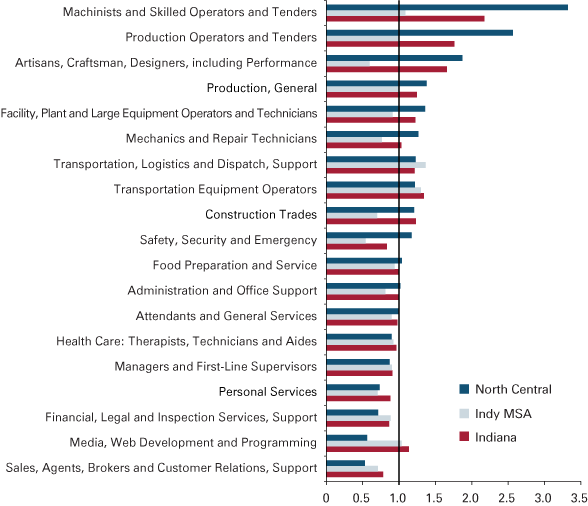
Note: An LQ of 1 shows an employment concentration equal to the nation. Clusters are sorted based on the North Central LQ.
Source: IBRC estimates using Quarterly Survey of Employment and Wages and Occupation Employment Survey data from the BLS
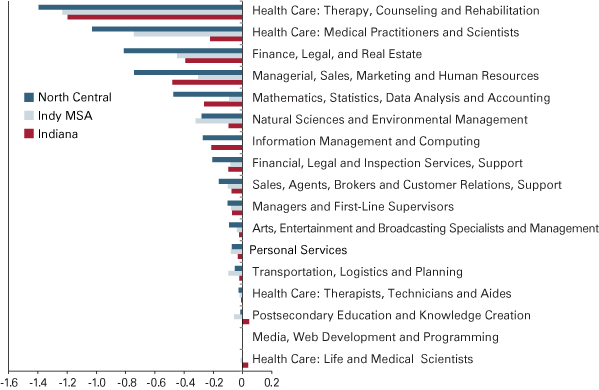
Figure 4 presents the KST concentration quotient. That is, it adjusts the standard LQ by the level of difficulty associated with transitioning to a cluster of occupations that require greater levels of knowledge and skills. Five occupation clusters are in relatively low concentration in North Central Indiana:
- Health Care—Medical Practitioners and Scientists
- Finance, Legal, and Real Estate
- Health Care—Therapy, Counseling and Rehabilitation
- Managerial, Sales, Marketing and Human Resources
- Mathematics, Statistics, Data Analysis and Accounting
Figure 4: Largest Negative KST Concentration Quotients for North Central Indiana, 2012
Source: IBRC estimates using Quarterly Survey of Employment and Wages and Occupation Employment Survey data from the BLS
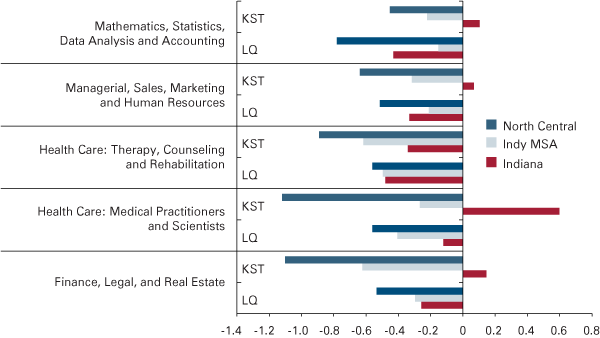
Figure 5 compares the standard vs. KST approaches for this trimmed-down set of occupation clusters more directly. The bar chart shows that with the exception of the mathematics, statistics, data analysis and accounting cluster, the KST concentrations indicate that closing the human capital gap in the North Central region will be more difficult than the standard LQ analysis. (It also shows that it would be difficult for the region “to poach” these occupations from the Indianapolis MSA.)
Figure 5: North Central Indiana Low Concentration Occupation Clusters, Comparing Standard LQ and KST Concentration Results, 2012
Source: IBRC estimates using Quarterly Survey of Employment and Wages and Occupation Employment Survey data from the BLS
Aggregating occupations (or industries) is one thing, but as with most analysis, the devil abides in the detailed occupations. The left-hand set of three columns in Table 1 presents the location quotients for the occupations in the region with particularly low concentrations compared to the Indianapolis-Carmel MSA, the state of Indiana and the nation (which equals 1). One might immediately note that chemists and computer systems analysts in the region, compared to the Indy MSA, have a particularly low concentration.
The right-hand set of columns in Table 1 show the KST concentrations of the three regions.3 It shows that some occupations are more of a challenge to develop than others. In the region, computer systems analysts are in relatively low concentration, but the human capital gap for them is greater than for word processors or telemarketers. Policy makers in the region would do well to be concerned about the human capital gap as it relates to physicians and surgeons and civil engineers since these occupations may be a constraint to growth.
Table 1: Standard LQ vs. KST Concentration for Occupations in the North Central Indiana Region, 2012
| Occupation Title | Location Quotient | KST Concentration | ||||
|---|---|---|---|---|---|---|
| North Central | Indy MSA | Indiana | North Central | Indy MSA | Indiana | |
| Architectural and Civil Drafters | 0.28 | 0.91 | 0.83 | -0.03 | -0.00 | -0.01 |
| Environmental Scientists and Specialists, Including Health | 0.28 | 0.67 | 0.39 | -0.02 | -0.01 | -0.02 |
| Chemists | 0.27 | 2.01 | 1.23 | -0.02 | 0.03 | 0.01 |
| Physicians and Surgeons, All Other | 0.26 | 1.42 | 0.82 | -0.95 | 0.54 | -0.24 |
| Instructional Coordinators | 0.26 | 0.48 | 0.37 | -0.06 | -0.04 | -0.05 |
| Securities, Commodities, and Financial Services Sales Agents | 0.25 | 0.98 | 0.63 | -0.16 | -0.00 | -0.08 |
| Computer Systems Analysts | 0.24 | 1.21 | 0.71 | -0.20 | 0.06 | -0.08 |
| Word Processors and Typists | 0.24 | 0.35 | 0.32 | -0.00 | -0.00 | -0.00 |
| Market Research Analysts and Marketing Specialists | 0.24 | 1.10 | 0.50 | -0.13 | 0.02 | -0.08 |
| Telemarketers | 0.24 | 0.61 | 0.56 | -0.00 | -0.00 | -0.00 |
| Civil Engineers | 0.23 | 0.87 | 0.53 | -0.15 | -0.03 | -0.09 |
Note: Highlighted cells indicate the most challenging KST gaps to close.
Source: IBRC estimates using Quarterly Survey of Employment and Wages and Occupation Employment Survey data from the BLS
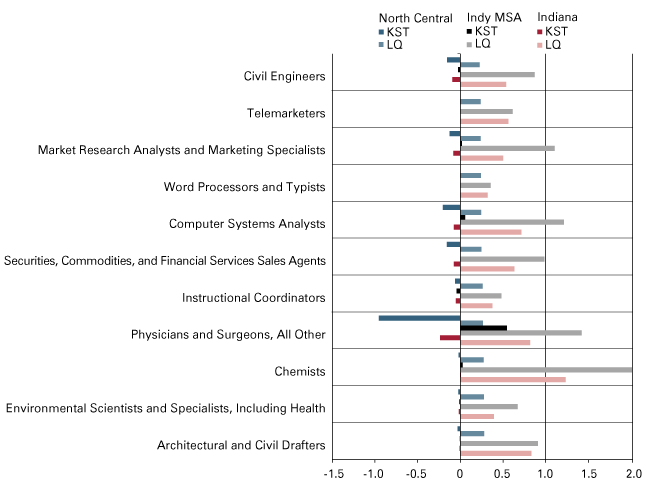
Figure 6 presents these data graphically. The standard LQs in Figure 6 show the region to be relatively low in concentration for physicians, computer systems analysts, civil engineers and market research analysts. The KST framework helps to begin the conversations of “how do we close the gaps” by adding a measure of difficulty. Word processers are easy to develop; analysts are not.
Given that occupations of a complementary set, or of a particular nature, can be of importance for an economic developer either interested in wooing a new firm into the neighborhood or looking into the future to determine whether his or her region is ready for economic growth or industrial expansion, understanding the human capital constraints is of paramount importance. The KST framework is a step closer to an easy-to-understand measure for an economic development practitioner to know his or her region.
Figure 6: Comparison of Standard LQs and KST Concentrations for Occupations in the North Central Indiana Region, 2012
Source: IBRC estimates using Quarterly Survey of Employment and Wages and Occupation Employment Survey data from the BLS
Conclusion
Hoosier economic development practitioners, as well as job seekers looking to transition to new occupations, have a couple of new tools. The Virtual Career Counselor distills all of the complex elements of an occupation into one measure that can be used to determine the level of relative difficulty one would have moving to another occupation. While other career counseling resources are important, and one should be cautious about planning one’s life around just one “transition-time” measure (this is why there are many skills and career tests to more precisely measure aptitude), having one way to easily reduce the set of options has great appeal.
Economic development practitioners can also use these data, at least indirectly. By combining the standard location quotient of occupational concentration with the transition time, one produces a metric that shows the relative difficulty associated with closing the human capital gap. The knowledge, skills and training gap can be, therefore, a useful measure to sell a region’s human capital strengths, a signal to warn about possible human capital deficiencies, and a point of departure for conversations about curriculum development and a region’s strategic plan.
View additional appendix material.
Notes
- Note that the analysts used “KST” for knowledge, skills and training instead of the often used “KSA” for knowledge, skills and abilities because the analysis did not find that “abilities” differentiated between occupations in a meaningful way.
- See “Boiling Point? The Skills Gap in U.S. Manufacturing” by Deloitte on behalf of the Manufacturing Institute (2011) at http://ow.ly/uguKG. The top three “serious skill deficiencies” (Figure 9, page 8) were “inadequate problem-solving skills,” followed by “lack of basic technical training” and “inadequate basic employability skills (attendance, timeliness, work ethic, etc.)” The latter skill type, often called life skills, out-polled computer and math skills.
- A note to the reader: this analysis was conducted using the beta version of the Hoosiers by the Numbers website and data. For explanatory purposes, the beta version is fine, but note that by the time this article releases, the data will be improved and finalized.


