South Bend and Elkhart Area Forecast 2010
Director, Bureau of Business and Economic Research; Assistant Professor of Economics, School of Business and Economics, Indiana University South Bend
November 2009
The Michiana region, comprised largely of the South Bend-Mishawaka and Elkhart-Goshen metropolitan areas, faced significant setbacks during the recent recession, including slowed production, substantial job loss, and shrinking real wages. Recovery in 2010 will come slowly, particularly for employment.
Gross Domestic Product
Real gross domestic product (RGDP) for the region dropped substantially due to the recession, particularly in manufacturing-dominated Elkhart.1 RGDP decreased 9.1 percent in 2008 in Elkhart and decreased 0.5 percent in South Bend. Based on the percentage change in RGDP, Elkhart ranked 365 (second worst) out of the 366 metropolitan areas in the United States, and South Bend ranked 278th. The size of the local metropolitan economies in 2008 was $10.6 billion (in chained 2001 dollars) in South Bend and $8.9 billion in Elkhart.
Employment
The recession adversely affected local labor conditions. One cause of concern is the region’s shrinking labor force. In September 2009, there were 11,609 fewer people in the labor force of the combined South Bend and Elkhart metropolitan areas than in September 2007.2 South Bend’s labor force shrank 4 percent during this period, while Elkhart’s labor force contracted by over 6 percent. The reduction in the labor force could be a sign of growth in the number of discouraged workers and the out-migration of workers from the area.
Figure 1 shows metropolitan unemployment rates for 1990 to 2009. Local unemployment rates continued their rapid ascent since 2008, reaching their peaks in early to mid-2009. Due to substantial declines in employment caused by the slowdown of the RV industry, Elkhart faced some of the worst labor market conditions in the United States, with its unemployment rate reaching 19 percent in March 2009. Insulated somewhat by its more diverse economic base, including a concentration in education and health care, South Bend’s unemployment rates were relatively lower—though still high—in 2009.
Figure 1: Elkhart-Goshen and South Bend-Mishawaka Unemployment Rates, 1990 to 2009
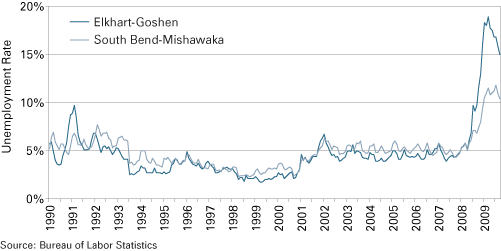
Table 1 reports employment data by industry for the region’s metropolitan areas. The region has lost a staggering number of jobs as a result of the recession that officially began in the fourth quarter of 2007. Approximately 245,800 people were employed in nonfarm sectors across the region in September 2009, with employment being about 31,800 higher in South Bend compared to Elkhart. From September 2007 to September 2009, total nonfarm employment decreased more than 11 percent, with a loss of 7,700 jobs in South Bend and 23,600 jobs in Elkhart. Much of this job loss occurred since the fourth quarter of 2008.
Table 1: Employment by Industry and Metro Area, September 2009*
| Industry | South Bend | Elkhart | Combined | |||
| Employ- ment |
Change since September 2007 | Employ- ment |
Change since September 2007 | Employ- ment |
Change since September 2007 | |
| Total Nonfarm | 138,800 | -7,700 | 107,000 | -23,600 | 245,800 | -31,300 |
| Manufacturing | 16,800 | -3,000 | 44,000 | -18,500 | 60,800 | -21,500 |
| Professional and Business Services | 13,000 | -1,200 | 7,200 | -1,900 | 20,200 | -3,100 |
| Trade, Transportation, and Utilities | 27,200 | -1,200 | 17,400 | -1,200 | 44,600 | -2,400 |
| Natural Resources, Mining, and Construction | 5,600 | -1,000 | 3,800 | -700 | 9,400 | -1,700 |
| Leisure and Hospitality | 12,600 | 0 | 6,700 | -900 | 19,300 | -900 |
| Other Services | 5,400 | -400 | 3,600 | -400 | 9,000 | -800 |
| Government | 16,300 | -900 | 9,200 | 200 | 25,500 | -700 |
| Financial Services | 6,600 | -400 | 3,100 | -100 | 9,700 | -500 |
| Information | 2,000 | -100 | 700 | -100 | 2,700 | -200 |
| Educational and Health Services | 33,300 | 500 | 11,300 | 0 | 44,600 | 500 |
*September 2009 data are preliminary
Source: Bureau of Labor Statistics
Manufacturing was the hardest hit sector, losing 21,500 jobs largely due to massive layoffs and closings in transportation and related manufacturing sectors. Heavily affected by plummeting RV production, Elkhart lost 18,500 manufacturing jobs since September 2007. Manufacturing employment will likely remain low in the year ahead as the RV and automotive markets remain weaker than previous years, consumer confidence remains shaky, and credit markets stay tight.
Even among non-manufacturing sectors, all experienced employment losses from September 2007 to September 2009, except private educational and health services that saw a modest gain of 500 jobs in the South Bend metro area. The largest non-manufacturing losses were in professional and business services, with a combined loss of 3,100 jobs in the region. Other sectors suffering sizeable losses included trade, transportation and utilities (-2,400 jobs); natural resources, mining and construction (-1,700 jobs); leisure and hospitality (-900 jobs); other services (-800 jobs); and government (-700 jobs). The only sector expanding in Elkhart was government. Employment in services and trade will likely remain weak as consumer demand continues to be relatively low. The government sector, which includes public education and hospitals, will likely stagnate or fall as public budgets continue to tighten.
Wages
Unlike the previous year, real wages saw a clear decline in the past year across the region.3 The real average weekly wage fell 4.7 percent to $683 (in constant 2009 dollars) from the first quarter of 2008 to the first quarter of 2009 in the two metropolitan areas combined. Wages, however, did not fall at the same pace across the region. The real average weekly wage decreased 4.1 percent in South Bend and 9.2 percent in Elkhart. The overall decline in wages reflects the slowdown in economic activity during the recession, while the relatively stronger decline in Elkhart comes from the more severe reduction in labor demand in that area. Despite the overall decline in wages, changes in wages varied considerably across sectors. Among the nineteen sectors for which data are available across the region, eleven saw positive growth. Given the expected sluggish rebound of labor demand as the economy begins to recover, wage growth will be minimal in the coming year, particularly in sectors with sizeable labor surpluses.
Housing
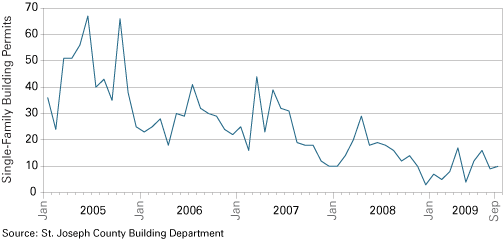
Residential construction, measured by the number of new single-dwelling housing permits issued in St. Joseph County, remained soft in 2009 but exhibited some signs of improvement beginning in the summer. From January 2009 to September 2009, only 88 new housing permits were issued, compared to 156 during the same period in 2008 and 247 in 2007 (see Figure 2). While low in number, 2009 saw some growth in new permits, particularly in April, June, and July, with intermittent downturns in February, May, and August. The region should experience modest growth in housing demand due to the expected upturn in economic activity, stabilized financial markets, and the availability of federal stimulus incentives in the short term. Continued tight credit conditions and high local unemployment will work against this growth.
Figure 2: Single-Family Residential Building Permits in St. Joseph County, 2005 to 2009
Summary
In 2009, the Michiana region continued to bear the burden of a sluggish economy that began declining in 2007: significant job loss, high unemployment rates, lower real wages on average, and weak new home construction. Yet, 2009 showed signs of improvement, with production improving in some sectors, unemployment rates beginning to fall, and real wages expanding in certain sectors. The outlook for 2010 is optimistic, though not overly so. The worst effects of the recession have likely occurred and economic conditions should improve as the national economy recovers. The Michiana region should experience falling unemployment rates, modest job growth, some improvement in real wages, and increased activity in housing markets. The local rate of recovery will depend on the speed and depth of the national upturn, the health of the manufacturing sector, and the ability to re-employ the substantial local labor surplus. The impact of the recovery will depend on the ability to sustain economic growth in the future.
Notes
- Data from the Bureau of Economic Analysis: www.bea.gov/newsreleases/regional/gdp_state/2009/pdf/gsp0609.pdf.
- Data from STATS Indiana, Labor Force Estimates Time Series View: www.stats.indiana.edu/laus/laus_view3.html.
- Data from STATS Indiana, Covered Employment and Wages: www.stats.indiana.edu/cew/.
Also in this Issue…
- Outlook for 2010
- International Outlook for 2010
- U.S. Outlook for 2010
- Financial Outlook for 2010
- Housing Market Outlook for 2010
- Indiana's Outlook for 2010
- Indiana's Agricultural Outlook for 2010
- Anderson Forecast 2010
- Bloomington Forecast 2010
- Columbus Forecast 2010
- Evansville Forecast 2010
- Fort Wayne Forecast 2010
- Gary Forecast 2010
- Indianapolis-Carmel Forecast 2010
- Kokomo Forecast 2010
- Lafayette Forecast 2010
- Louisville Forecast 2010
- Muncie Forecast 2010
- Richmond Forecast 2010
- South Bend and Elkhart Area Forecast 2010
- Terre Haute Forecast 2010