Housing Market Outlook for 2010
Director, Benecki Center for Real Estate Studies; Charles H. and Barbara F. Dunn Professor of Finance and Real Estate, Kelley School of Business, Indiana University Bloomington
November 2009
The new term that has become part of our language when talking about the housing market is a “short sale.” This is not like a short sale for stocks where you sell a stock you don’t own in anticipation of a price decline. Rather it means that you purchased a home at a price that is lower than what is owed on the mortgage—thus the lender is “short” on the amount received. Lenders do this to avoid the time and costs of foreclosure. Borrowers avoid the stigma of having defaulted on the loan because the lender agrees to accept the lower loan balance knowing that they are not likely to get any more money for the property by going through foreclosure. The property is listed with a broker and sold at a price that is less than the loan balance with the lender’s approval. Of course, all the funds go to the lender.
The fact that an increasing number of the sales that took place over the past year were short sales is indicative of the state of the housing market. The bad news is that a lot of the sales are short sales with the lenders incurring losses and the borrowers losing their homes. The good news is that these sales are helping to clear out the inventory of homes that have negative equity, which is important to the eventual recovery of the housing market.
Housing Inventory
The supply of unsold homes has fallen dramatically. According to U.S. News and World Report, “the raw number of unsold new homes posted its twenty-ninth consecutive monthly drop and now stands at its lowest level since 1982. While inventory remains at an elevated 7.5 months of supply, it too has fallen sharply from its recent peak of 12.4 months. Single-family housing starts will probably continue to grow because builders, at some point, will need to ramp up production. Rising housing starts will mean that the job losses in the residential construction sector will soon come to an end.”1 This will help boost the overall economy.
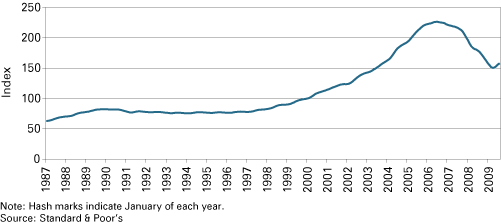
Home Prices
A lower supply of homes that are on the market also helps stem the downward spiral in home prices. There are now signs that home prices are stabilizing: If not rising, at least in many areas the rate of price decline has lessened considerably. The widely followed S&P/Case-Schiller Home Price Index composite for the ten largest cities fell every quarter on a national basis from July 2006 through April 2009. Since then, it has risen for four consecutive months (see Figure 1). Some areas such as Las Vegas and Cleveland still showed slight declines, but much smaller than previous months. Home prices actually rose slightly in Detroit after significant declines for several years due to the troubled automotive industry.
Figure 1: S&P/Case-Schiller Ten-City Composite Home Price Index, 1987 to 2009
“The S&P/Case-Schiller Home Price Index for twenty major U.S. cities fell 11.3 percent in August from a year earlier. That’s a significant improvement from the January reading, which showed a 19 percent year-over-year drop in property values,”according to Luke Mullins at U.S. News and World Report.2
”The 11.3 percent year-over-year drop that the twenty-city composite posted in August was the smallest such decline since January of 2008 and modestly stronger than the 11.9 percent drop economists had expected. It represents an improvement from July, when prices fell 13.3 percent from a year earlier. While many of the markets remain down versus this time last year, the relative rate of decline has shown some real improvement.”3
Home Sales
The National Association of Home Builders (NAHB) reports that “after five consecutive months of increases, sales of newly built single-family homes fell 3.6 percent to a seasonally adjusted annual rate of 402,000 units in September.”4 This is a decline of 8 percent from a year earlier. This suggests, according to economist Zach Pandl at Nomura Global Economics, that “the recovery is going to proceed somewhat slowly and that we are definitely not out of the woods yet.”5 According to U.S. News and World Report, “the disappointing data on the market for new homes come just days after the September existing-home sales report showed a surprising 9 percent surge. One factor behind this discrepancy is that the two reports apply the term ‘sale’ differently. Existing-home sales are counted when the transactions close, while new-home sales are tallied when the sales contracts are signed. ‘New-home sales were reasonably strong around midsummer and existing-home sales were strong in September,’ Pandl says.”6
NAHB reports that “on a regional basis, new-home sales were down 10 percent in the South, which is the nation’s largest housing market, and were down 10.6 percent in the West. The sales rate did not change in the Northeast in September, but gained 34 percent in the Midwest.”7
First-Time Homebuyer Tax Credit
Home sales are also increasing due to the $8,000 first-time homebuyer tax credit that President Obama signed into law in mid-February. Estimates suggest that the tax credit was responsible for as many as 400,000 additional home sales by the time it was originally set to expire at the end of November. The fall 2009 dip in sales may have been due to this impending expiration. Sales were trailing off as people started to run out of time to close sales before the deadline. However, in early November, the credit was extended by Congress and that should begin to stimulate sales again. Joe Robson, chairman of NAHB, noted that “extending the tax credit’s effective date for one year and expanding it to include all homebuyers would generate nearly 350,000 jobs, $28.2 billion in wages, salaries, and business income, and $11.6 billion in additional tax revenues.”8
The tax credit has been stimulating buyer demand along with the continuing low mortgage interest rate environment. “A number of factors, including cheaper home prices and attractive mortgage rates, have made buyers more comfortable making the biggest financial transaction of their lives,” according to U.S. News and World Report. “Thirty-year fixed mortgage rates, for example, averaged 5.45 percent in the week that ended August 14, down sharply from 6.65 percent a year earlier.”9
Housing Starts
NAHB projects total housing starts to increase in 2010 and 2011 (see Table 1). In 2010, starts will increase from about 564,000 expected for the balance of 2009 to 716,000 in 2010 and 1,059,000 in 2011. Although this is a nice improvement, the pace of housing starts will be well below the peak level of 1,800,000 in 2006. The NAHB also projects that the interest rate for fixed and adjustable interest rate mortgages will increase slightly in 2010 and 2011.
Table 1: National Association of Home Builders Forecast, 2006 to 2011
| 2006 | 2007 | 2008 | 2009 | 2010 | 2011 | |
| Housing Activity (in Thousands) | ||||||
| Total Housing Starts | 1,812 | 1,342 | 900 | 564 | 716 | 1,059 |
| Single-Family | 1,474 | 1,036 | 616 | 445 | 600 | 894 |
| Multi-Family | 338 | 306 | 285 | 120 | 116 | 165 |
| New Single-Family Home Sales | 1,049 | 769 | 481 | 389 | 525 | 806 |
| Existing Single-Family Home Sales | 5,712 | 4,960 | 4,341 | 4,416 | 4,975 | 6,025 |
| Interest Rates (%) | ||||||
| Federal Funds Rate | 4.96 | 5.02 | 1.93 | 0.16 | 0.13 | 0.41 |
| Ninety-Day T-Bill Rate | 4.85 | 4.47 | 1.39 | 0.19 | 0.27 | 0.59 |
| Treasury Yields: | ||||||
| One-Year Maturity | 4.93 | 4.52 | 1.82 | 0.51 | 0.74 | 1.29 |
| Ten-Year Maturity | 4.79 | 4.63 | 3.67 | 3.24 | 3.78 | 4.29 |
| Freddie Mac Commitment Rates | ||||||
| Fixed Rate Mortgages | 6.42 | 6.33 | 6.04 | 5.09 | 5.36 | 5.79 |
| Adjustable Rate Mortgages | 5.54 | 5.56 | 5.18 | 4.77 | 4.89 | 5.31 |
| Prime Rate | 7.96 | 8.05 | 5.09 | 3.25 | 3.25 | 3.44 |
Notes: Data are averages of seasonally adjusted quarterly data and may not match annual data published elsewhere.
Source: National Association of Home Builders
Conclusion
The housing market will show some growth in 2010; but, like the overall economy, it will be muted. Home prices are expected to rise slowly in most markets. Nonresidential construction will be weighed down by excess supply and tight credit for firms seeking to buy or lease space. Interest rates will rise slightly but remain low by historical standards, with some upward pressure possible late in the year. Mortgage rates will average 5 percent to 6 percent.
Notes
- Luke Mullins, “Weak Home Sales Suggest a Slog of a Recovery,” U.S. News and World Report: The Home Front Blog, October 28, 2009, www.usnews.com/money/blogs/the-home-front/2009/10/28/weak-home-sales-suggest-a-slog-of-a-recovery.html.
- Luke Mullins, “Home Price Declines Becoming Less Jarring,” U.S. News and World Report: The Home Front Blog, October 27, 2009, www.usnews.com/money/blogs/the-home-front/2009/10/27/home-price-declines-becoming-less-jarring.html.
- Ibid.
- NAHB, “New Home Sales Fall in September,” National Association of Home Builders, October 28, 2009.
- See note 1 above.
- See note 1 above.
- See note 4 above.
- See note 4 above.
- See note 2 above.
Also in this Issue…
- Outlook for 2010
- International Outlook for 2010
- U.S. Outlook for 2010
- Financial Outlook for 2010
- Housing Market Outlook for 2010
- Indiana's Outlook for 2010
- Indiana's Agricultural Outlook for 2010
- Anderson Forecast 2010
- Bloomington Forecast 2010
- Columbus Forecast 2010
- Evansville Forecast 2010
- Fort Wayne Forecast 2010
- Gary Forecast 2010
- Indianapolis-Carmel Forecast 2010
- Kokomo Forecast 2010
- Lafayette Forecast 2010
- Louisville Forecast 2010
- Muncie Forecast 2010
- Richmond Forecast 2010
- South Bend and Elkhart Area Forecast 2010
- Terre Haute Forecast 2010