

Closing the gap: Workforce and housing affordability
Associate Director, IU Center for Real Estate Studies
Available, affordable housing is a necessary component of workforce and economic development.
Without it, workers either migrate to other cities in search of a better combination of jobs and affordability; become cost-burdened (defined as housing costs exceeding 30% of income); or, even worse, experience homelessness or housing insecurity. Therefore, affordability impacts the ability of states and municipalities to bring new jobs to an area and retain existing workers. Because economic development is so dependent on workforce availability, the long-term fate of local economies is tied very closely to companies having sufficient workforce and, thus, workers having access to housing in the areas where they work at a price they can afford. However, a gap exists today between the workforce and necessary housing … and it’s growing.
In today’s housing market, a confluence of issues has created a dramatic decrease in affordability, which has led to a crisis-level mismatch of supply and demand for affordable housing across much of the United States. Indiana, long a bastion of affordability, has experienced a reversal of fortunes in this area. The U.S. and Indiana share the main issues for workforce and housing today: insufficient housing supply, housing prices/rents outpacing income growth and locked-in mortgage rates and lower mover rates hindering worker mobility.
Undersupply meets the largest generation
Today’s undersupply of housing really started in the wake of the housing bubble of the mid-2000s. Insatiable investor appetite for mortgage-backed securities and loose lending practices, particularly in the subprime market, fueled high levels of new construction and rising home prices. Throughout the Global Financial Crisis (GFC) and the ensuing period of recovery, lenders had little appetite for new housing development, so building permits plummeted and stayed low for a number of years (see Figure 1).
Figure 1: U.S. and Indiana residential building permits
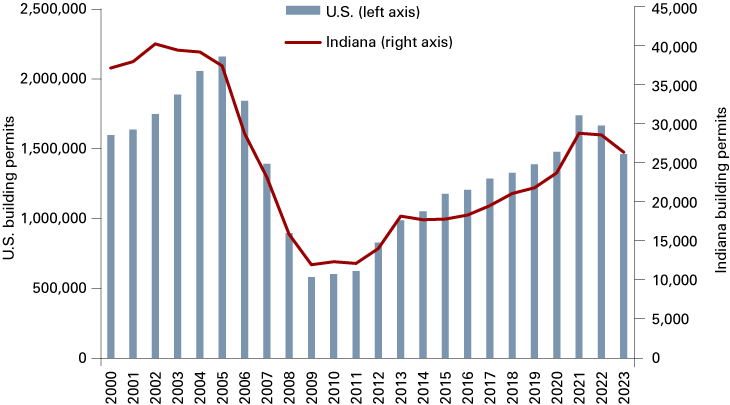
Source: Federal Reserve Bank of St. Louis, U.S. Census Bureau and U.S. Department of Housing and Urban Development
However, a critical event was occurring during this period of low building permits. The millennials, the largest generation in history, were coming of age to form their own households and become owners or renters. The failure to plan for the housing needs of this generation left us far short of necessary housing units, a factor that is more profoundly affecting cities like Indianapolis, which has a combined shortfall of more than 100,000 housing units since 2000. Figure 2 shows nationwide and Indiana housing shortfalls and surpluses from 2000 to 2023.
Figure 2: U.S. and Indiana estimated housing shortfall or surplus
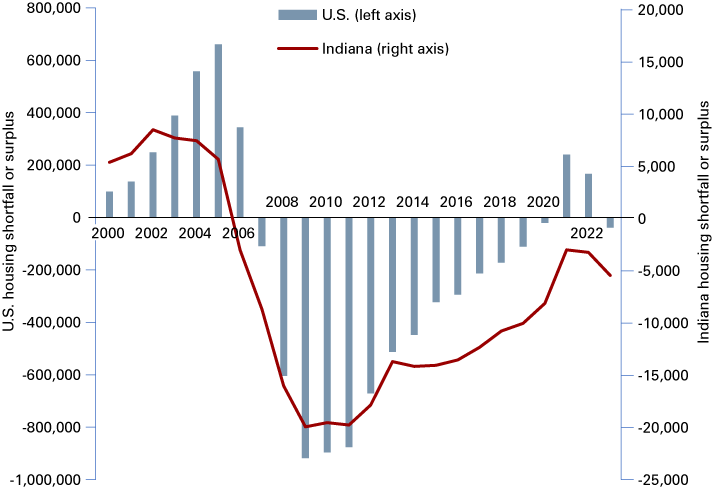
Source: Federal Reserve Bank of St. Louis, U.S. Census Bureau and U.S. Department of Housing and Urban Development; author’s calculations
Of course, it took a once-in-a-lifetime pandemic and record household formation rates to snap us out of the lull in construction. Unfortunately, those circumstances also brought with them supply chain and labor disruptions, resulting in skyrocketing costs for labor and materials, leaving the real estate industry without a clear path to cure the supply-demand imbalance. The result has been record-low available housing units per household (based on average active listings). Nationally, there is only one available housing unit per 230 households, a far cry from one housing unit per 102 households in 2017 (see Figure 3). Indiana housing availability has reached crisis levels, with only one available housing unit per 308 households. Compare that to 2017, when there was one unit available for every 116 households.
Figure 3: Number of households per one available housing unit in the U.S. and Indiana
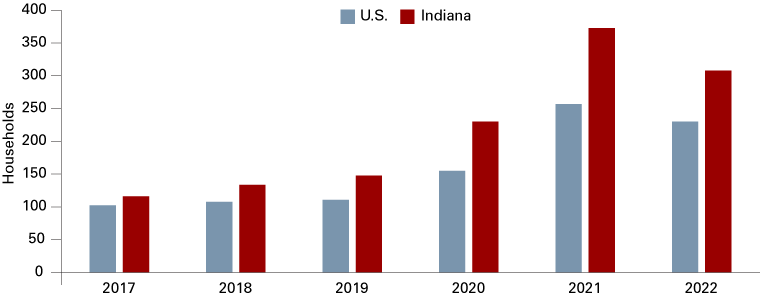
Source: Federal Reserve Bank of St. Louis, Realtor.com Housing Inventory Core Metrics and U.S. Census Bureau total households
With so few housing options in a woefully undersupplied market, it is no wonder prices and rents have risen so dramatically.
Homeowners losing ground
Over the last 10 years, household formation has outpaced population growth, largely due to the coming-of-age of millennials and the breakup of multi-generational households, combined with lower birth rates. Employment growth has also kept a strong pace, as evidenced by low unemployment rates, despite workforce participation rates falling below the long-term average. This strong labor market has resulted in hourly wage growth of nearly 38% in the U.S., though only 32% in Indiana, just barely keeping abreast of inflation of 32% over the last 10 years (see Figure 4).
Figure 4: Housing metric changes over the last 10 years in the U.S. and Indiana
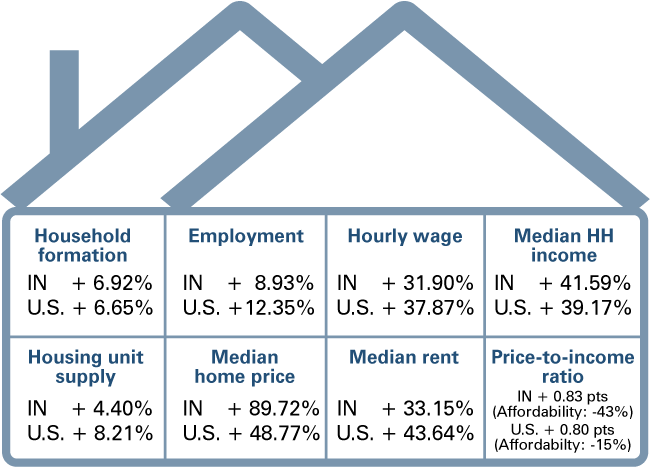
Note: Household formation, employment, median household income, housing unit supply and price-to-income ratio were calculated using data from 2013 and 2022. Hourly wage, median home price and median rent were calculated using data from 2014 and 2023.
Source: STATS Indiana; StatsAmerica; Federal Reserve Bank of St. Louis
Wage growth has not trickled down directly to household income growth in the U.S, though household income growth has exceeded wage growth in Indiana over the last 10 years. This fact does not make housing price growth of 90% in Indiana (compared to 49% in the U.S.) any less troubling, considering record-high price-to-income ratios and record-low affordability, with Indiana more greatly impacted than the U.S. at large.
Price-to-income ratio is a strong measure of housing affordability, though it does not take into account the impact of mortgage rates, which were typically below 5% post-GFC until 2022. While low interest rates helped maintain affordability, they were a major factor in the run-up in home prices during and after COVID, until the Federal Reserve shifted the interest rate climate with increases that began in 2022.
Renters have had it a little easier. While U.S. rents have largely kept pace with home prices (a 44% 10-year rent increase versus a 49% 10-year home price increase), Indiana renters have fared far better than homeowners, with only a 33% increase over the last decade compared to a 90% home price increase in that time. Overall, homeowners have certainly lost the most ground, though U.S. households are not experiencing the same shocks to the system as Indiana. For a state prized for its affordability in the past, Indiana is now struggling to distinguish itself in an economy where workers have more choice and more opportunities.
Locked into housing and locked out of opportunity
While the workforce has been in a more powerful bargaining position with employers over the last few years due to labor shortages, the low interest rates of the recent past have come back to bite us in terms of worker mobility. Approximately 79% of homeowners nationwide have interest rates locked in below 5% on their homes, with Indiana close behind at 76%, providing a powerful incentive to stay put (see Figure 5).
Figure 5: Distribution of locked-in mortgage rates for the U.S. and Indiana in 2023 Q3
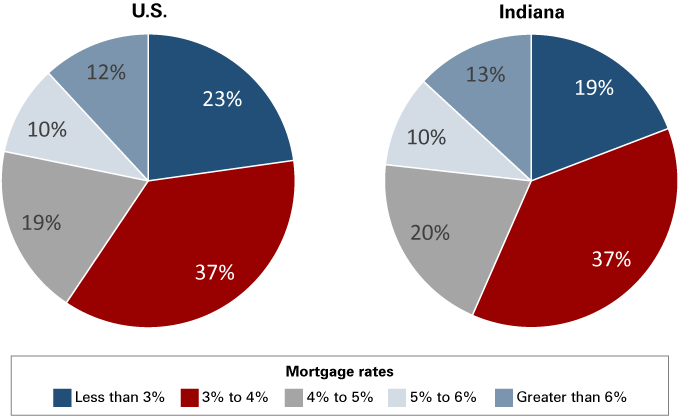
Source: Federal Housing Finance Agency, National Mortgage Database
According to a recent survey by John Burns Research & Consulting, 5.5% is a mortgage “tipping point,” with 62% of consumers pointing to 5.5% as a historically “normal” mortgage rate and 71% of prospective home buyers saying they would not accept a mortgage rate above 5.5%. With rates hovering around 7%, the idea of moving, even for a job opportunity, becomes less likely, particularly considering that higher wages may not result in the ability to afford more.
For example, at 5% interest rates, a 30-year mortgage with a 20% down payment for the median home price in Indiana ($242,500) would result in a monthly payment of around $1,041. With interest rates at 7% (which assumes good-to-excellent credit today), that payment increases $250 per month to $1,291, requiring a corresponding increase in income of at least $10,000 per year, or $4.81 per hour (assuming 30% of income is allocated to housing). This is a tall order for workers trying to keep up with the high prices of groceries, gas and more. For people with rates even lower than 5%, the gap grows.
With so many homeowners’ mortgage rates locked in and so few housing options available, mover rates remain low. Typical moving activity has been hampered by inadequate frictional vacancy, the amount of space needed to facilitate normal moves between housing units. The mover rate has fallen over time and reached an all-time low of 8.4% in 2021, the height of working from home, and ticked up only slightly in 2022. With lower mover rates, housing options are especially reduced for younger generations, as older generations remain in their homes rather than downsizing into smaller, and potentially more expensive, housing options. Without this transition of housing across generations, worker mobility again is impacted.
With all of these factors in place, employers are driving a push for innovation in the housing market to address issues such as worker mobility and employee retention.
Innovating for the benefit of the workforce
Despite a long history in the U.S. of “company towns,” where employers constructed housing for workers (ostensibly to trap employees with monopolistic housing), employers and housing have largely been detached for many recent decades, as the free market generally facilitated new housing developments that kept supply and demand in equilibrium and prices moving accordingly. With all of the factors at play over the last decade in the housing market, combined with workforce shortages and shifts in how people work over the last five years, employers have ventured back into housing in a new way, as they take the reins to drive innovation in housing affordability and availability.
Employers, like Cook Medical in Indiana, have begun constructing affordable for-sale housing for employees. In 2022, Cook Medical announced it would construct 300 homes in south-central Indiana for its employees, addressing both lack of housing availability and affordability for workers. Cook will sell these homes to employees at below-market prices; in turn, employees are required to live in the home, and if they want to sell in the first three years of ownership, Cook has the option to buy it back for what they sold it to the employee for. Other companies throughout the U.S., like Disney, Meta and various others, are constructing affordable housing for rent or sale because competition for workforce once again means making housing accessible.
Amazon is taking this idea one step further with the Amazon Housing Equity Fund, which provides grants, loans and capital partnerships to enable affordable housing construction by playing a part in the capital stack, the sources of capital that pay for the costs of development or acquisition. Its efforts have thus far been focused in the areas where its largest operations are based – Seattle; Northern Virginia/Washington, D.C. and Nashville. While some view Amazon’s efforts as an offset to the effect Amazon employment centers have on a local housing market (increase in demand resulting in increased prices), it also helps retain employees by creating more low-income housing (for those typically earning between 30% and 80% of an area’s median household income) and middle-income housing (for those typically earning between 80% and 120% of an area's median household income).
Middle-income workforce has been the hardest submarket for whom to solve the affordability issue because there are few programs to assist with the creation of workforce housing. While low-income housing is based on income qualification and constructed using federal tax credits, the middle-income workforce is often relegated to clamoring for the lower end of market-rate housing, which are often homes that are older, need work or are in tertiary locations. In other words, middle-income workers typically make too much money to qualify for low-income housing and too little money to truly afford market-rate housing. With few new housing units being added to the lower price/rent end of market-rate housing, this price bracket has grown more competitive as older housing units are purchased, upgraded and flipped for higher prices or leased for higher rents, thus removing them from this segment of the housing stock. A workforce housing tax credit program, like the middle-income housing tax credit (MIHTC) legislation proposed in Congress, is one way to tackle this issue. However, considering how competitive low-income housing tax credits (LIHTC) have become, it is highly likely that this solution alone will not be enough.
Private developers, however, have been stepping in to fill this gap with more efficient construction methods, like volumetric modular construction techniques, such as those being used at VoluMod in Indianapolis. VoluMod builds housing components in a climate-controlled factory that can be assembled on a foundation on-site. This construction method is being used to produce multi-unit residential developments as well as smaller floor plan, single-unit residential housing. Along with more efficient construction techniques, new and resized housing products like this are another way developers are adapting to and innovating in the housing market.
Along with new housing products and construction techniques, the return of “missing middle” housing products is part of a growing movement amongst urban planners, housing advocates and municipalities to rethink zoning regulations. These movements seek to restore the ability to develop product types like duplexes, triplexes, fourplexes and small multi-unit residential buildings on a larger scale, as well as change regulations that create potentially burdensome restrictions, such as minimum dwelling unit size. While zoning reform alone is not enough to fix the supply issue with middle-income housing, a groundswell of support for this type of change would meaningfully contribute to the toolbox of potential remedies for the gap between housing supply and housing demand for the majority of the country’s workforce.
It is clear that economic development requires available workforce, and workforce development and retention is inextricably linked to available and affordable housing. With workers continuing to struggle to find and afford housing, how that impacts the success of local companies and the potential ripple effect on the economy is an ongoing cause for concern.
Will employer initiatives, government programs and innovative housing types and techniques be enough to rectify the supply-demand imbalance and bring affordability back to states like Indiana, where the middle-income workforce is so essential to a manufacturing- and logistics-driven state economy? None of these solutions alone are enough. But together, they may just bridge the gap.
