
Uncertainty in the national real estate market
Associate Director, Indiana University Center for Real Estate Studies
For two years during the pandemic, the housing market was red hot. Then, in 2022, the market appeared to slow down, with the National Association of Realtors (NAR) Pending Home Sales Index—a leading indicator for the housing sector—falling to a low of 75.5 in November 2022, a drop of nearly 27% since March of that year. Things picked up over the winter, but fell again in March 2023 (see Figure 1).
Figure 1: Pending Home Sales Index and median home price in the U.S.
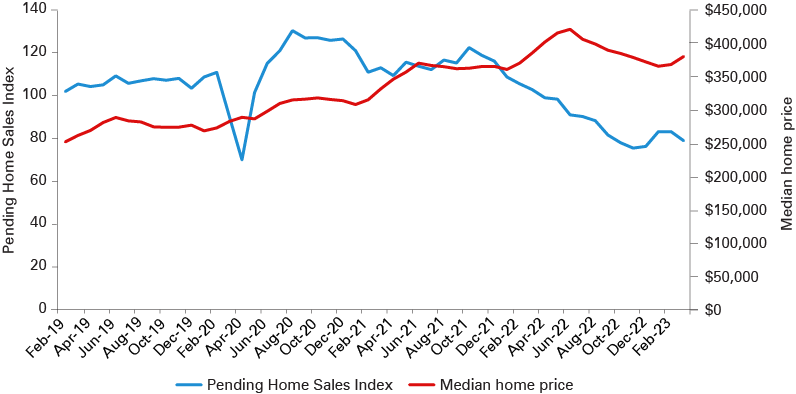
Note: The median home price is based on existing single-family homes.
Source: National Association of Realtors
Prices have also been falling, but the median home price in February 2023 is still higher than 2021’s median home price (though down almost 13% since the peak in June 2022 as shown in Figure 1).
I am a big fan of roller coasters, but the housing market has had more twists and turns than I can handle lately. With so much uncertainty right now, people are wondering where the housing market is headed. Will we ever return to “normal?” The answer is as much psychological as it is mathematical.
The story of today’s housing market has a lot to do with two economic principles – supply and demand (how many houses are for sale and how many people want them) and purchasing power (how much people can buy with the money they have). But the cooling market stems as much from what people think is happening as it does from what is actually happening.
As a real estate appraiser for 15 years and now full-time faculty teaching real estate to college students, I have long been an observer of buyers and sellers in the market. My career has been as much about understanding people’s motivations and behaviors as it has been about performing financial calculations.
The supply legacy of the Great Recession
The story of the housing market over the last two years and today’s uncertainty has been almost two decades in the making. In late 2005/early 2006, the housing market hit its pre-2021 peak. Prices were high and mortgage lenders had made it easy – many would say too easy – for most people to get a loan. In 2006, the median home price to median household income ratio hit 3.75, the highest number on record at that time, which means people were paying prices nearly four times their income (see Figure 2). The higher this index rises, the more unaffordable home prices become.
In 2006, between steaming hot prices and the easy money available from lenders, the market was too hot. This sounds a lot like 2022, when the median home price to median household income ratio reached 6.46, the highest ever for this metric, as we came off a period of “easy money” due to the lowest interest rates in history. And today, like then, the market clearly reached its boiling point and was forced to cool off.
Figure 2: Median home price to median household income ratio in the U.S.
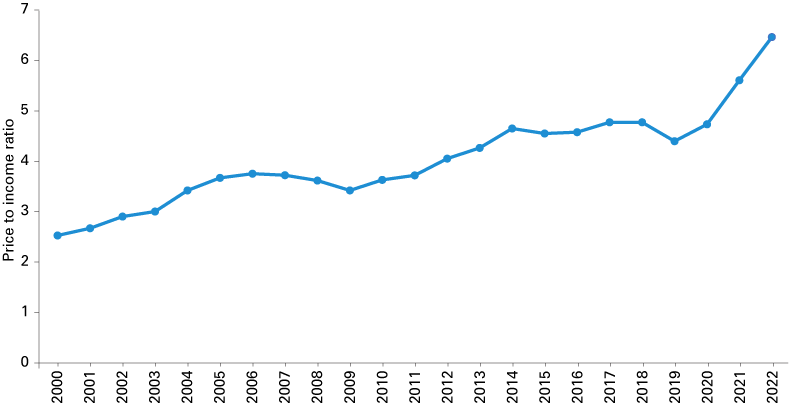
Note: Median household income data has not been released for 2022, so the author is using the 2021 value.
Source: Author’s calculations using Federal Reserve Bank of St. Louis economic data for median sales price of houses sold, not seasonally adjusted (https://fred.stlouisfed.org/series/MSPUS), and median household income, not seasonally adjusted (https://fred.stlouisfed.org/series/MEHOINUSA646N).
The obvious reaction to the overheated housing market and changing economic conditions in 2006 was that buyers stopped buying and prices slid downward for the next six years.1 The other, less obvious, part of how people reacted to the housing crisis was that fewer new homes were built. A lot fewer. From the late 1990s through 2006, 1.5 million to 2 million new homes were being built every year in the U.S., but then, those numbers fell off a cliff. By the time 2009 rolled around, only about 583,000 new homes were being constructed each year. While those numbers began increasing substantially in 2012, it wasn’t enough. In fact, it wasn’t until 2021 that the U.S. even hit 1.5 million new homes per year again (see Figure 3).
Figure 3: New building permits in the U.S.
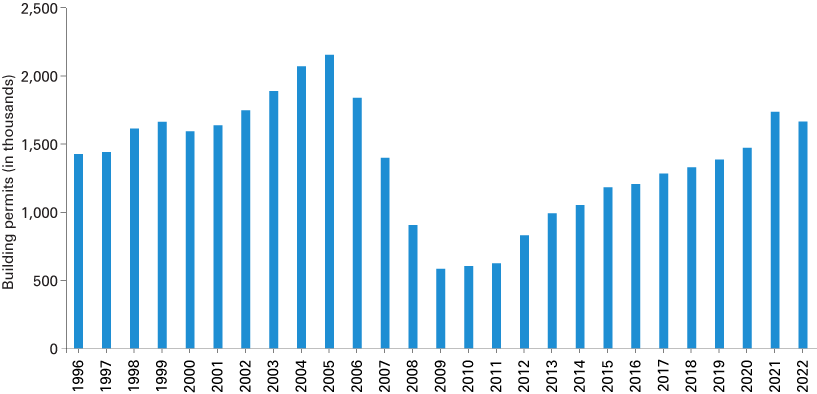
Source: U.S. Census Bureau
All this time, people still wanted to buy homes, and households were growing as people became adults, moved out, had children, formed new households and grew the population. However, a vast number of millennials became adults during the Great Recession, so they did not buy homes as early or as frequently as generations that preceded them, which disguised the growing supply problem. So, the legacy of the Great Recession is the supply, or rather undersupply, part of this story. The U.S. did not build enough new housing to keep up with population growth and household formation, and this lack of new construction was catching up to the housing market when COVID hit.
The COVID demand spike
By 2019, the housing market was humming along after a long recovery. People were forgetting about the Great Recession. Millennials were moving out of their parents’ basements and buying their own homes. The market had become a seller’s market around 2015, though few people noticed. Confidence in our housing market was at an all-time high, with over half of Americans believing home prices would continue to rise.2
Over 3 million new households formed in 2020, nearly double 2019’s household formation, as multi-generational households broke up. When conditions are right and people start buying homes in large numbers, a buying frenzy begins.
But bubbling underneath this high level of consumer confidence was the lack of new construction, which meant the housing market had become slowly, stealthily undersupplied. By the time COVID hit in 2020, we had all been lulled into a general state of content about the housing market. As people huddled in their homes, they longed for more space (or space away from their parents) and began soothing themselves with the most indulgent form of retail therapy – home buying.
Over 3 million new households formed in 2020, nearly double 2019’s household formation, as multi-generational households broke up.3 When conditions are right and people start buying homes in large numbers, a buying frenzy begins. People saw their friends and relatives moving and followed suit. Like those who panic-bought toilet paper and hand sanitizer, people panic-bought living space. And just like that, demand made a return in a major way.
All this demand, combined with the lurking supply problem, made buyers willing to pay more…and more…and more. The high-demand, low-supply situation was made worse by investors turning more homes into rentals. With lack of affordability at an all-time high and a little something called inflation, the market was spinning out of control.
So, the federal government stepped on the brakes.
Interest rates change purchasing power
Interest rates are considered the counterbalance to inflation. The Federal Reserve (Fed) can strategically raise the base building block rate to make borrowing and spending less appealing. The Fed started doing this in 2022, resulting in 10 federal funds rate (fed funds) increases in the last year, totaling 500 basis points. The goal of the Fed is to change people’s behaviors. And it’s been working—to an extent.
Buyers have stopped buying at the same pace as before, though they are still buying. Affordability has changed; that is undeniable. Let’s look strictly at the math: a buyer purchases a home for $625,000 in 2021. Assuming a 20% down payment, that buyer could take out a $500,000 mortgage with a 3% interest rate, equating to a roughly $2,100 monthly payment. With rates at 7%, that $2,100 payment means that same buyer can only borrow about $317,000, which means they can only pay $396,000 for the house, about 37% less.
In a perfectly rational world, when interest rates increase this much, buyers would lower their offers accordingly, and sellers would adjust their expectations, too. When the Fed raises their rates, lenders often react by raising interest rates to reflect their updated view of risk in the market. How does that explain 30-year mortgage rates decreasing after the Fed’s November rate increase?
Banks start with the Fed’s base rate to “build” their interest rates. Sitting on top of the Fed’s base rate is a premium to pay the bank back for taking the risk of lending to a specific person, in a specific location, based on the current economic and market conditions. Even the banks realize actual risk is lower than the Fed’s moves imply – their initial reaction was to raise rates close to 7% in November 2022 when the Fed raised their rates, but banks quickly realized there was not as much risk as they thought. In fact, the basis point difference between the fed funds rate and the average 30-year fixed rate mortgage is as low in April 2023 as it has been since 2019, prior to the pandemic (see Figure 4). All of this indicates that lenders’ perceptions of risk are lower than they have been in years.
Figure 4: Federal funds rate, 30-year fixed rate mortgage average and basis point difference
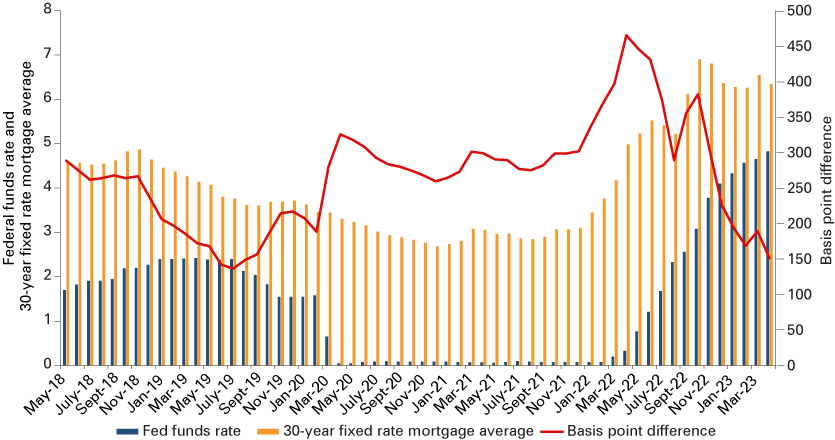
Source: Author’s calculations using Federal Reserve Bank of St. Louis economic data for federal funds effective rate (as a percent), not seasonally adjusted (https://fred.stlouisfed.org/series/FEDFUNDS), and 30-year fixed rate mortgage average in the United States (as a percent), not seasonally adjusted (https://fred.stlouisfed.org/series/MORTGAGE30US).
Buyers may be following suit. Higher interest rates have caused fewer people to buy homes, but despite fewer home sales, prices are not dropping as one would expect. That is because how people gauge the value of real estate is largely based on their perceptions of the market, not strictly the math of the market.
The psychology of home buying
Determining the price of a home is a meeting of minds. What is a buyer willing to pay, and what is a seller willing to accept? No one relishes the idea of overpaying for something so pricey. So, some buyers see lower prices on the horizon and are willing to wait. Few analysts agree on how far housing prices will fall in 2023, but they all agree that they will (though not to the tune of 37%).4 Interest rates will fluctuate, but will remain higher than they have been for many years, causing a likely permanent change in affordability for buyers. Sellers, who have been in charge for the past six to seven years, have the biggest psychological shift to make.
The housing market tends to be seasonal as we go into hibernation mode, but sales decreased more than typical this past winter, as cold air was not the only chill hitting the market. We normally see activity start increasing in early spring, not decreasing, as NAR’s Pending Home Sales Index indicates for early spring 2023. Sellers are reacting to the new market reality by simply not selling.
According to Realtor.com, though median listing prices are up only 2.5% over the last year (indicating some sellers are adjusting to the impact of interest rates on affordability for buyers), active listings are up 48% from April 2022 and new listings are down (-21%) year-over-year. The combination of these two numbers tells us houses are staying on the market longer and fewer people are listing their houses for sale. We see this also in the fact that median days on the market are up 53% since last year, though the median time on the market this April (49 days) still falls well below the typical 60 days on the market we saw in the month of April prior to the pandemic (see Figure 5).
Figure 5: Median days on market
Source: Realtor.com Inventory Core Metrics
All of these metrics signal that housing is shifting away from the strong seller’s market of the last few years, which would typically be a good sign for buyers. But, we can also see the psychology of the market in these numbers—sellers are trying to take back control by restricting new inventory. And with the majority of the country in possession of a mortgage with a rate below 5%, what is the incentive to move?5
The crystal ball
Soon, buyers will adjust to life with higher interest rates, as they have in the past. When rates trend downward, predicted to begin sometime in the second half of 2023 and into 2024, buyers will feel like they are hitting the jackpot.6 Will rates ever again be as low as they were in 2021? Probably not. Once most people change their expectations about interest rates, the long-run average of a 5.5% mortgage will sound enticing again.
Once buyers know that prices are going to stop falling, they will remember that they still want a house, and the U.S. is still falling far short on housing supply, particularly for owner-occupants, who are also competing with hedge funds and other investors. Current estimates by the St. Louis Fed indicate household formations have outpaced housing inventory growth over the last decade (see Figure 6) to create a shortage of nearly 3.7 million housing units.
Figure 6: New households, new housing inventory and the difference
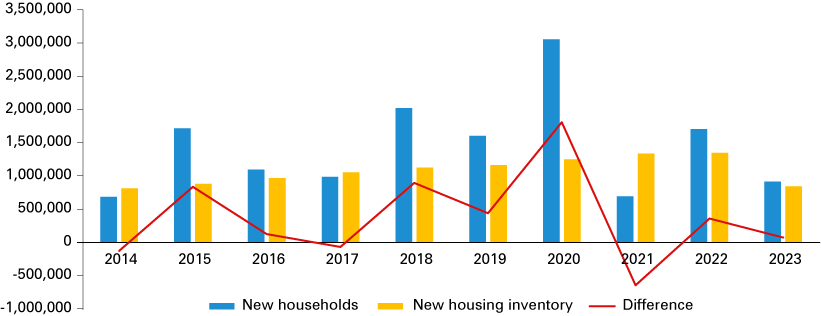
Note: 2023 is only data from Q1.
Source: Author’s calculations using Federal Reserve Bank of St. Louis economic data for household estimates, not seasonally adjusted (https://fred.stlouisfed.org/series/TTLHHM156N), and housing inventory estimates, not seasonally adjusted (https://fred.stlouisfed.org/series/ETOTALUSQ176N#0).
Sellers, who have seen their home values rise substantially over the last two years, will accept that a drop of, say, 10% in prices is only cutting into the windfall that they would have gotten had they sold in 2021, not into their real equity. The market is at the peak of uncertainty right now, and it will remain chilly until buyers grow sick of waiting, sellers resign themselves to lower prices or likely both. Will we ever return to normal? What is “normal” is the real question. However, there is no question that the market will heat up again because, while psychology has played a major role in cooling off the market, the purely mathematical problem of not having enough new housing is not going away anytime soon.
Notes
- St. Louis Fed. 2023. “S&P/Case-Shiller U.S. National Home Price Index.” Last modified April 25, 2023. https://fred.stlouisfed.org/series/CSUSHPISA
- Fannie Mae. 2020. “Home Purchase Sentiment Index Caps off Strong 2019 near Its Survey High.” January 7, 2020. https://www.fanniemae.com/research-and-insights/surveys/home-purchase-sentiment-index-caps-strong-2019-near-its-survey-high
- St. Louis Fed. 2023. “Household Estimates.” Last modified May 3, 2023. https://fred.stlouisfed.org/series/TTLHHM156N
- Lloyd, Alcynna. 2022. “Home Prices Are Falling at the Fastest Rate in 15 years. 11 Real Estate Analysts and Economists Break Down How Bad They Think It's Going to Get in 2023.” December 12, 2022. https://www.businessinsider.com/housing-outlook-this-is-how-far-us-home-prices-could-fall-and-when-2022-11
- Katz, Lily, and Marr, Taylor. 2022. “85% of Homeowners with Mortgages Have a Rate Far Below Today’s Level, a Factor Prompting Many to Stay Put.” September 20, 2022. https://www.redfin.com/news/homeowners-locked-into-low-mortgage-rates
- Chatham Financial. 2023. “Term SOFR, USD LIBOR, and Treasury Forward Curves.” Last modified May 10, 2023. https://www.chathamfinancial.com/technology/us-forward-curves
