Foreign Direct Investment in Indiana
Economic Research Analyst, Indiana Business Research Center, Indiana University Kelley School of Business
Foreign direct investment (FDI) is one way to measure the scope and degree of a region’s globalization (exports being another). FDI contributes financially to the state’s economy and often provides job opportunities for local residents. This article provides an overview of the recent historical data from the Bureau of Economic Analysis (BEA) on FDI trends nationally, in the Midwest and Indiana specifically, as well as “real-time” FDI announcements made between 2009 and 2011 for planned investments in new and expanded plants and equipment. For a more detailed analysis, read Capturing the Flag: Foreign Direct Investment in Indiana, available at www.stats.indiana.edu/topic/exports.asp.
Historical FDI (2007-2009)
FDI data from the BEA cover U.S. businesses newly acquired or established by foreign direct investors. In 2009, the United States had nearly 5.3 million workers employed at enterprises where a foreign investor or company had at least a 50 percent stake, otherwise known as a majority-owned U.S. affiliate (MOUSA). Slightly more than 23 percent of these MOUSA workers were employed in the Midwest. In 2009, Indiana ranked 14th among states (same as 2008), with 131,400 workers employed at MOUSA firms (see Table 1). From 2007 to 2009, MOUSA employment declined in the U.S. by 5.5 percent, a trend mirrored in most Midwestern states except Missouri and Iowa.
Table 1: Majority-Owned U.S. Affiliate Employment in Midwestern States, 2009
| Geography | MOUSA Employment (in thousands) |
Change since 2007 | U.S. Rank |
|---|---|---|---|
| United States | 5,279.7 | -5.5% | n/a |
| Illinois | 250.8 | -10.6% | 5 |
| Ohio | 211.2 | -11.3% | 8 |
| Michigan | 134.8 | -11.7% | 13 |
| Indiana | 131.4 | -11.9% | 14 |
| Tennessee | 116.3 | -16.5% | 15 |
| Minnesota | 92.2 | -6.1% | 20 |
| Kentucky | 87.0 | -6.4% | 21 |
| Missouri | 85.5 | 3.8% | 22 |
| Wisconsin | 74.6 | -9.0% | 25 |
| Iowa | 46.0 | 1.1% | 29 |
Source: Bureau of Economic Analysis
The Origin of FDI
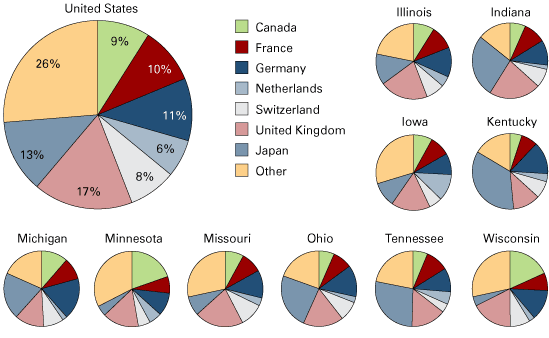
European countries accounted for 52.2 percent of the nation’s MOUSA employment in 2009 followed by “other countries” (such as Middle Eastern and Latin American countries) at 26.3 percent and Japan (12.5 percent). The Midwest, as a whole, followed similar trends with a slightly stronger presence from Japan and other countries compared to the nation, and less from Europe and Canada. At the individual country level, Japan held the largest share of MOUSA employment in Indiana at 26.9 percent (35,300 jobs). In the U.S. and Midwestern states, the United Kingdom was the dominant European country creating FDI jobs. Among Indiana’s neighboring states, Illinois had the largest employment presence from France and the United Kingdom (see Figure 1).
Figure 1: Midwestern States’ Majority-Owned U.S. Affiliate Employment by Source, 2009

Source: Bureau of Economic Analysis
FDI Employment
During the Great Recession MOUSA employment rolls declined nationally by 5.5 percent or 308,500 workers, reducing its MOUSA employment concentration to about 5 percent of total private employment in 2009. In Indiana, MOUSA firms accounted for 5.6 percent of Indiana’s total private sector employment. The state ranked 12th nationally and among its Midwestern neighbors, only Kentucky MOUSAs had a higher share of total private employment.
Midwestern states lost nearly 131,000 MOUSA jobs (-9.6 percent) and Indiana had the fifth highest job loss in the region at 17,700 workers. Only Missouri and Iowa gained MOUSA jobs during the recession, albeit slightly. Tennessee had the greatest percent change in MOUSA employment, yet Illinois lost the greatest number of jobs at 29,700.
FDI by Industry
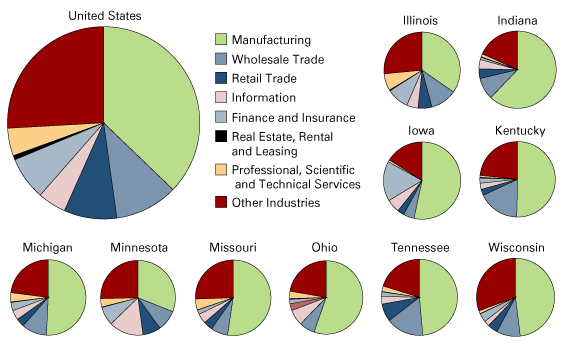
FDI-related employment spans multiple industries, with manufacturing remaining dominant at the national, regional and state levels in 2009 (see Figure 2). Beyond manufacturing, the second-largest industry category employing U.S. workers is “other industries” at 25.9 percent. Indiana follows a similar trend with manufacturing constituting 62.2 percent of total MOUSA employment, with “other industries” comprising 18.3 percent, and wholesale and retail trade at 9.1 percent and 4 percent, respectively. Industries where Indiana’s concentration of MOUSA employment was greater than the United States included manufacturing, wholesale trade and information.
Figure 2: Share of MOUSA Employment by Industry, 2009

Source: Bureau of Economic Analysis
Manufacturing Employment
In 2009, 37.2 percent of all FDI-related employment in the U.S. was in manufacturing, with the Midwest capturing 29.9 percent of all manufacturing-related FDI employment. Since 2007, manufacturing-related MOUSA employment as a percent of total employment has increased by 0.5 percentage points. In Indiana, 62.2 percent of total MOUSA employment was in the manufacturing sector, the second-highest percentage nationally (following Arkansas). These 81,700 MOUSA manufacturing jobs represented 18.5 percent of total private manufacturing employment in the state. This share of manufacturing employment exceeded the U.S. percentage of 16.6 percent and, among neighboring states, was surpassed by only Kentucky and Ohio. Compared to other regions of the country; manufacturing dominates MOUSA employment in the Midwest. In recent years, Indiana has become more attractive to foreign direct investors—particularly in manufacturing as it continues to capture one of the largest shares of MOUSA manufacturing employment among states over time.
FDI Announcements (2009 to 2011)
To get a more “real-time” measure of FDI, the IBRC uses an investment tracking service, fDi Markets (www.fdimarkets.com), to determine potential foreign direct investments in the U.S. from 2009 through 2011. This service tracks foreign direct investment announcements (through media releases) and often includes projected investment values and expected number of jobs that will be created. fDi Markets “counts” the FDI project the year it is announced with the understanding that it may take years before the investment is fully realized, if the project is realized at all. Additionally, an important difference compared to BEA data is that fDi Markets collects data on greenfield and expansion projects only. Merger and acquisition transactions are not captured in the fDi Markets data.
One must exercise some caution when using and interpreting fDi Markets data. As an announcement is made, fDi Markets uploads the data, thus enhancing its timeliness, but subsequent announcements or adjustments to that particular announcement may not be reflected in the database. Additionally, if investment or employment values are not announced explicitly, fDi Markets estimates these values with varying degrees of accuracy. Despite these inherent shortcomings, fDi Markets is our best source for current FDI activity.
FDI Announcements in the United States, Midwest and Indiana
Every year states announce forthcoming investments made by companies moving to or expanding within their borders as well as the expected new jobs needed to support the business. Nationally, between 2009 and 2011, the majority (91.5 percent) were intrastate investments made by U.S. businesses. In the Midwest and Indiana, however, over a quarter of the announcements were made by foreign countries (see Table 2).
Table 2: Foreign Direct Investment by Region, 2009 to 2011
| Region | Total Deals | Foreign Deals | Foreign Deals | |
|---|---|---|---|---|
| Value (in millions) |
Jobs | |||
| U.S.* | 48,108 | 4,081 | $182,768 | 352,458 |
| Midwest* | 2,884 | 799 | $38,387 | 78,598 |
| Ohio | 538 | 158 | $7,606 | 14,033 |
| Illinois | 474 | 156 | $5,509 | 9,195 |
| Indiana* | 483 | 136 | $5,111 | 11,799 |
| Michigan | 240 | 86 | $3,382 | 11,511 |
| Tennessee | 298 | 78 | $6,758 | 14,213 |
| Kentucky | 284 | 62 | $1,191 | 4,675 |
| Wisconsin | 162 | 43 | $6,093 | 6,917 |
| Missouri | 173 | 36 | $928 | 2,906 |
| Minnesota | 135 | 27 | $1,103 | 2,028 |
| Iowa | 98 | 17 | $707 | 1,321 |
*Indiana’s data have been verified, yielding more conservative estimates. The other states’ data represent unverified fDi Markets reported figures.
Source: fDi Markets
Recognizing that the data presented in this section includes estimated data from fDi Markets for cases where the expected capital investment or employment was not reported in the original announcement, the IBRC researched the Indiana announcements to corroborate the estimated figures.1 Although not all estimates could be vetted, the revised figures show Indiana had 136 announcements over this three-year period valued at $5.1 billion with an anticipated 11,800 jobs. The fDi estimates over-reported Indiana’s capital investment by $0.7 billion and 1,000 employees; therefore, the remainder of the article will use Indiana’s revised announcement figures.
Between 2009 and 2011, 4,081 FDI announcements were made in the U.S. with an estimated value of $182.8 billion and 352,460 anticipated jobs. The Midwest captured 19.6 percent of the nation’s FDI announcements with 799 reported investments valued at $38.4 billion and 78,600 anticipated jobs. Seventeen percent of the FDI within the Midwest was earmarked for Indiana, with an estimated value of $5.1 billion and the anticipated creation of 11,800 jobs. This expected value places Indiana fifth among its Midwestern neighbors with Ohio, Tennessee and Wisconsin capturing the highest levels of investments at $7.6 billion, $6.8 billion and $6.1 billion, respectively. With respect to employment, Indiana ranked third among Midwestern states behind Tennessee and Ohio. Beyond the Midwest, Indiana’s total estimated investments and job announcements ranked ninth in capital investments and 10th in total jobs nationally.
FDI Announcements by Industry
Nationally, the top three industries capturing foreign capital investments were the communications ($13.4 billion), automobile and components ($12.4 billion) and real estate ($10.3 billion) industries. Within Indiana, the top three investments by capital were in the alternative energy ($1.2 billion), coal/oil/natural gas ($894.8 million) and the automobile and components industries ($871.9 million). In the other Midwestern states, the coal/oil/natural gas, chemicals and metal industries were the top three future recipients of foreign capital investment flows of $8.9 billion, $2.9 billion and $2.8 billion, respectively. However, these large capital investments do not always correlate to large expected employment figures.
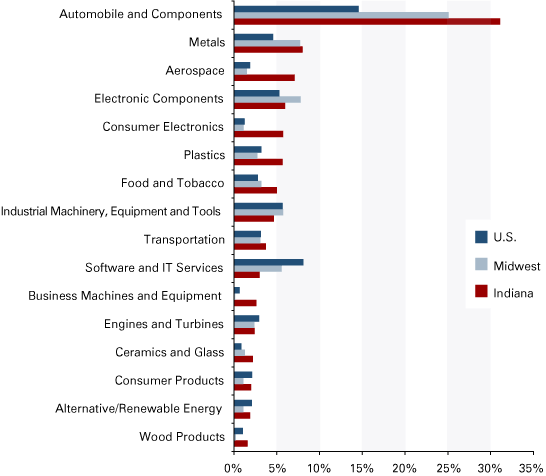
Figure 3 shows that Indiana’s top FDI-employment industries were automobiles and components (3,670 jobs, or 31.1 percent of the total) followed by metals (945 jobs, 8 percent) and aerospace (845 jobs, 7.1 percent). The state can expect new jobs resulting from the 41 FDI deals announced in the automotive industry between 2009 and 2011. The single largest auto-related deal was Honda’s announcement in 2011 for 1,000 jobs—27.2 percent of the auto-related jobs.
Figure 3: Projected FDI Employment by Industry Sector as a Share of Total MOUSA Employment, 2009 to 2011

Source: fDi Markets
The auto industry also had the largest share of total FDI employment announcements nationally and in the Midwest; however, FDI job announcements were more evenly distributed across industries. The expected 50,000 jobs related to auto sector FDI deals between 2009 and 2011 accounted for 14.2 percent of the U.S. total. Among the top destination states for auto sector FDI, Indiana had the fifth highest projection of auto-related jobs behind Alabama, Tennessee, Michigan and Georgia.2
In Indiana, the Great Recession certainly affected the FDI announcement volume—even in the automobile and components industry—creating some volatility in the past five years. Indiana has had a range of 4,350 expected jobs in 2006 to 229 jobs in 2008. The U.S. followed a similar trend with 2008 being a soft year for FDI job announcements. Since 2008, the state’s FDI-related job announcements in the automobile and components industry have continued to grow along with year-over-year increases in the total number of FDI announcements.
FDI by Business Activity
Nearly 74 percent of the FDI-related jobs announced in Indiana between 2009 and 2011 were in the manufacturing business activity. Business activity classifies FDI projects based on the primary task undertaken at a facility rather than on the type of product or service a company produces. While Indiana had the highest number of manufacturing FDI project announcements (95) between 2009 and 2011, it ranked fifth in the number of announced jobs (8,700). Nine of the top 10 states with FDI manufacturing jobs were in either the Midwest or the South, regions where most of the nation’s automotive plants are located. Indiana was not the only state to have heavy concentrations of manufacturing jobs as its 74 percent placed it at 15th place. Nationally, manufacturing represented 41.6 percent of FDI job announcements.
FDI by Source Country
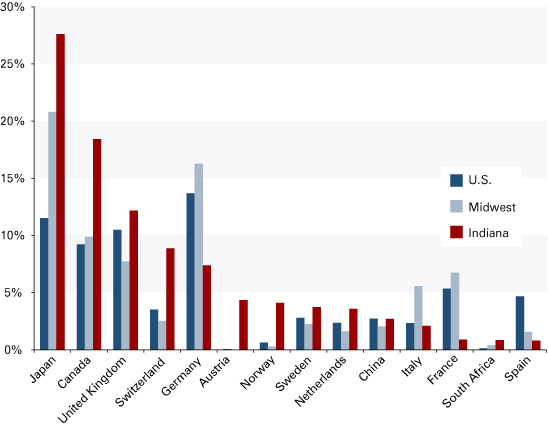
Japan was the largest source of FDI commitments in Indiana and the Midwest from 2009 through 2011. More than a quarter of Indiana’s announced FDI jobs came from Japan compared to 11.5 percent for the United States (see Figure 4). Germany, in contrast, was the top source of employment announcements for the United States at 13.7 percent. Rounding out the top five source countries that invested in Indiana from 2009 to 2011 are Canada (18.4 percent), the United Kingdom (12.2 percent), Switzerland (8.9 percent) and Germany (7.4 percent). Overall, these top five countries had 103 FDI announcements in Indiana within the past three years and expected employment of 8,788, comprising 75 percent of all announced Indiana FDI employment.
Figure 4: Share of Total Announced FDI Employment by Source Country, 2009 to 2011

Source: fDi Markets
Conclusion
Foreign direct investment plays an important role in Indiana’s economy, particularly in the manufacturing sector. U.S. Bureau of Economic Analysis data for 2009 show that Indiana’s MOUSA manufacturing employment share was greater than the nation’s, and FDI announcements between 2009 and 2011 indicate that this trend is continuing.
The Great Recession certainly affected the volume of FDI announcements nationally, regionally and statewide, but not all states were negatively affected. The continued growth of FDI announcements in Indiana in 2011 indicates that the state is still an attractive destination for foreign investment, particularly in the automobile and components industry and the manufacturing business activity.
Notes
- Research was done by searching press releases and news stories about companies’ investments within Indiana with a focus on confirming/denying the fDi reported employment and capital figures.
- Indiana’s rankings against other states may suffer slightly from the more conservative FDI announcement data used for Indiana. IBRC analysts scrub the fDi Markets data for Indiana, removing errant records—e.g., counting a plant retooling as a plant expansion—but the IBRC analysts do not scrub the data for other states.
Also in this Issue…


