
The Economic Footprint of Indiana’s Community Health Centers
Director of Economic Analysis, Indiana Business Research Center, Kelley School of Business, Indiana University
Economic Research Analyst, Indiana Business Research Center, Kelley School of Business, Indiana University
Beyond providing accessible, high-quality health care, Indiana's Community Health Centers (CHCs) also have a significant economic presence at both the state and county level. There are roughly eighty-five CHC facilities that operate primarily in 40 counties across the state. CHCs provide primary health care services by state-licensed professionals to community members.
This article highlights findings from a recent study commissioned by the Indiana State Department of Health and the Indiana Primary Health Care Association and conducted by the Indiana Business Research Center (IBRC).1 The study utilized a web-based survey of CHC administrators. Seventy out of the state's eighty-one sites in operation during this period responded for a response rate of 86 percent.2
Methodology
The expenditure data was analyzed using IMPLAN, an input-output modeling software that tracked the economic linkages associated with CHC expenditures.3 In a manner of speaking, this approach tracks the money that re-circulates in a local or regional economy. For example, as money moves from the nurse at a CHC to the auto mechanic, to the proprietor of the local bait and tackle shop—the money circulating through the economy. This approach measures the effect of the direct spending of a typical CHC as well as its ripple effects. Direct effects have to do with the change in dollars or employment associated with the direct spending of a CHC.4
In addition to estimating the economic ripple effects of CHCs, the estimated value of gifts-in-kind donated by private companies and nonprofit organizations was developed. Gifts-in-kind, such as patient medications, medical devices and non-medical supplies comprise a significant form of support for a community clinic. In a sense, state appropriation and private foundation funding leverage additional support in the form of gifts-in-kind.
CHCs also leverage resources in the form of volunteers—volunteers who would command a significant level of compensation if they were on the payroll. To estimate the value of each type of volunteer service, an equivalent occupation and compensation based on data from the U.S. Bureau of Labor Statistics was assigned.5
Statewide Economic Footprint
Indiana's Community Health Centers had an estimated economic footprint of $195 million. The majority of this sum, $126 million, is the result of direct spending of CHCs (see Table 1). The economic ripple effects total $68 million. For every dollar spent directly by the average CHC, there is an additional 54 cents of economic activity within the state.
Table 1: Statewide Economic Footprint of Indiana's Community Health Centers
| Direct Effects | Ripple Effects | Total | |
| Purchases | $36,478,880 | $28,838,205 | $65,317,084 |
| Construction | $7,179,714 | $5,593,336 | $12,773,050 |
| Payroll | $82,422,866 | $34,074,000 | $116,496,865 |
| All | $126,081,460 | $68,505,541 | $194,586,999 |
Source: IBRC, using 2007 IMPLAN model results from data obtained through the Community Health Center Survey
CHCs also generate an estimated 1,446 jobs across the state, including 861 jobs directly and an additional 586 jobs through economic ripple effects (see Table 2).
Table 2: Statewide Employment Effects and State and Local Tax Effects of Indiana's Community Health Centers
| Direct Effects | Ripple Effects | Total | State and Local Tax Effects | |
| Purchases | 256 | 247 | 502 | $2,418,597 |
| Construction | 73 | 49 | 122 | $492,445 |
| Payroll | 532 | 290 | 822 | $6,100,294 |
| All | 861 | 586 | 1,446 | $9,011,336 |
Source: IBRC, using 2007 IMPLAN model results from data obtained through the Community Health Center Survey
Spending by CHCs and the economic ripple effects of that spending also produce a wide range of tax revenues for state and local governments. Table 2 shows that these taxes total more than $9 million.
County-Level Economic Footprint
At the county level, the economic footprint of CHCs vary according to the relative number, size and spending of operations within each county. Table 3 shows that CHCs within Marion County had an economic footprint of $35 million, accounting for 233 jobs and $1.6 million in state and local taxes.
Table 3: County-Level Economic Footprints of Indiana's Community Health Centers, 2007
| County | Economic Impact | Employment | State and Local Tax |
| Marion* | $35,663,313 | 233 | $1,624,799 |
| Lake | $5,846,518 | 45 | $254,830 |
| Porter | $5,661,423 | 38 | $240,627 |
| St. Joseph* | $5,160,293 | 39 | $224,067 |
| Allen | $4,553,994 | 34 | $199,866 |
| Delaware | $3,367,334 | 27 | $149,457 |
| Vanderburgh | $3,303,562 | 25 | $138,317 |
| Elkhart | $3,219,154 | 24 | $124,690 |
| Tippecanoe* | $2,765,262 | 19 | $113,105 |
| Wayne | $1,885,083 | 16 | $75,458 |
| Howard | $1,800,782 | 12 | $67,549 |
| Johnson | $1,573,998 | 11 | $72,431 |
| Randolph | $1,538,291 | 9 | $52,022 |
| Madison | $1,389,042 | 11 | $58,770 |
| Floyd | $1,343,329 | 12 | $46,550 |
| Clark | $1,037,310 | 8 | $44,086 |
| Jackson | $1,021,707 | 7 | $40,110 |
| Grant | $832,566 | 7 | $32,347 |
| Cass | $745,795 | 5 | $26,213 |
| Rush | $613,397 | 3 | $20,625 |
| LaPorte | $562,261 | 4 | $25,647 |
| Parke | $378,402 | 2 | $12,044 |
| Ohio | $377,524 | 4 | $12,415 |
| Monroe | $363,289 | 3 | $14,864 |
| Clay | $347,691 | 2 | $11,434 |
| Lawrence | $309,389 | 2 | $12,431 |
| Pike | $255,914 | 1 | $7,182 |
| Boone | $138,714 | 1 | $5,608 |
| Switzerland | $125,929 | 1 | $3,327 |
| Henry | $124,573 | 1 | $4,828 |
| Pulaski | $91,885 | 1 | $3,076 |
| Owen | $83,628 | 1 | $2,343 |
| Bartholomew | $65,459 | 1 | $2,549 |
*The figures for Marion, St. Joseph, and Tippecanoe counties do not include estimates for a few centers that did not complete the Community Health Center Survey.
Note: Community Health Centers in Brown, Carroll, Crawford, Daviess, Gibson, Martin, and White counties did not complete the survey.
Source: IBRC, using IMPLAN model results from data obtained through the Community Health Center Survey
Typically, counties with larger economies will also have larger multipliers. In the same way, the state as a whole has a larger multiplier than any one county. As one would expect, Figure 1 shows that Marion County (with twenty-two CHCs) and St. Joseph County (with six primary CHCs) are among the ten counties where each dollar of CHC spending generates an additional 30 cents or more of spending in the local economy.
Figure 1: Comparison of Economic Multipliers by County for Community Health Centers Active in 2007
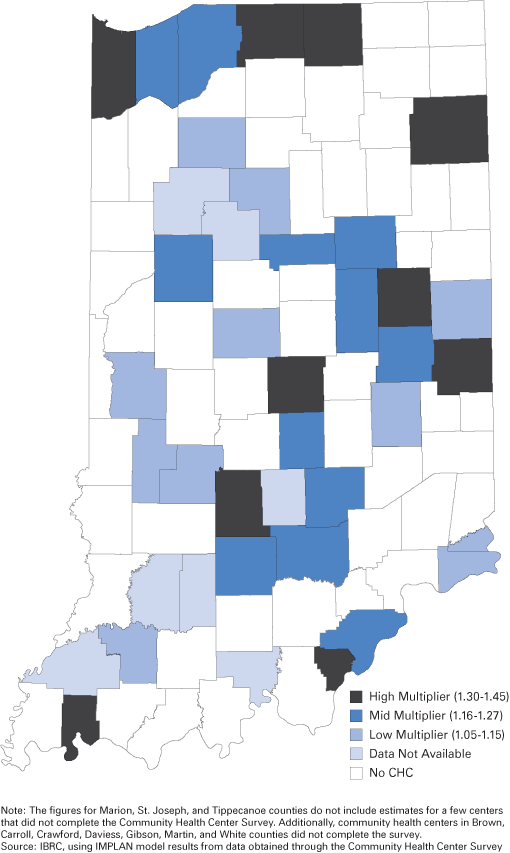
However, even though Allen County has only one CHC, it is also among this group of counties with a greater multiplier. This suggests that a relatively high proportion of this CHC's purchases are sourced in Allen County and that a relatively high proportion of its staff live in the county.
Gifts-in-Kind
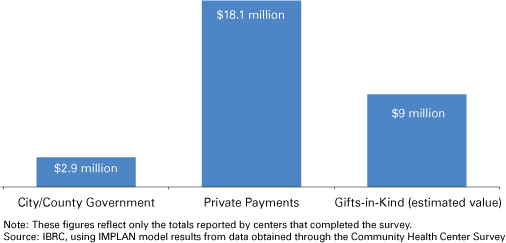
CHCs reported an estimated $9 million in donations from local (within county) sources. For the centers reporting gifts-in-kind, these non-monetary forms of support are equal to about half of the $18 million they receive from private payments within the county and three times as much as they receive from local governments (see Figure 2).
Figure 2: County-Level Revenue Sources for Indiana Community Health Centers, 2007
Considering income from all geographic sources, the reported value of gifts-in-kind is more than $14 million, higher than 10 percent of the value of all monetary income sources ($125 million). Figure 3 illustrates that the value of gifts-in-kind contributions is slightly higher than state funding ($13 million) reported by centers that completed the survey.
Figure 3: All Income Sources for Indiana Community Health Centers, 2007
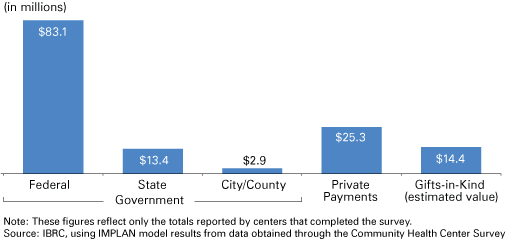
This suggests that every dollar appropriated by the state is matched by $1.07 in non-monetary support.
Volunteering
Volunteers further augment CHC support by way of unpaid hours of service. Figure 4 shows that the most popular volunteer activities reported were basic medical care (21 percent of all volunteer hours) and advanced medical care (15 percent). Together these medical activities amounted to over 25,000 hours of annual volunteer service. Another 10,000 volunteer hours were devoted to advisory boards or financial services.
Figure 4: Volunteer Activity for Indiana CHC Staff, 2007
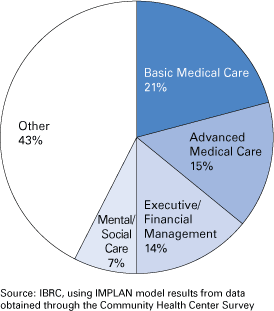
Table 4 summarizes the estimated value of CHC volunteer-related activities for those centers that reported volunteer activity. The conservative estimate of these 71,000 hours of service is $945,000.
Table 4: Estimated Economic Impact for Volunteering Activities of Indiana Community Health Center Staff, 2007
| Volunteer Role | Total Annual Hours | Equivalent Hourly Compensation | Total Equivalent Compensation/Year |
| Advanced Medical Care | 10,655 | $39.25 | $418,234 |
| Basic Medical Care | 14,831 | $14.29 | $211,925 |
| Mental/Social Care | 5,208 | $19.48 | $101,445 |
| Executive/Financial Management | 10,287 | $24.26 | $249,563 |
| Other | 30,402 | $10.32 | $313,833 |
| Total | 71,383 | $1,295,001 | |
| Overall Economic Impact of Volunteering (using 73% price-to-client value ratio) | $945,351 | ||
Note: These figures only include data for the 56 centers that submitted volunteer information in the survey. Equivalent hourly compensation is based on wages and benefits of similar occupations. The overall economic impact assumes a 0.73 market price-to-client value ratio as discussed in the full report.
Source: IBRC, using IMPLAN model results from data obtained through the Community Health Center Survey
Conclusion
Statewide, the economic footprint of Indiana's Community Health Centers is nearly $200 million. Every dollar of direct spending by CHCs generates another $0.54 in economic ripple effects in the state. Gifts-in-kind totaled an additional $14 million and volunteering activities at CHCs an equivalent value of approximately $945,000.
CHCs not only play a crucial role in providing accessible health care but also have a significant economic footprint at both the state and county level. Given that state appropriations are able to leverage additional resources—gifts-in-kind and volunteer service—that equal if not exceed those appropriations, there is no exaggeration in saying that community health centers are an excellent value.
Notes
- The full report is available at www.ibrc.indiana.edu/studies/Community_Health_Centers_2009.pdf.
- A few centers have opened and others have closed during the past year. More information is available from the Indiana State Department of Health, Primary Care Office document: “Mapping Indiana Community Health Centers, Fiscal Year 2008,” www.in.gov/isdh/files/CHC_and_maps_GIS_08.pdf. IBRC analysts estimated expenditures of missing centers for statewide calculations.
- More IMPLAN information is available at http://implan.com.
- Please see the full report for complete methodological details.
- Total compensation (wages and legally-required benefits) is further discounted at 73 percent using a factor of proportionality. Scholarly support for such an approach comes from: Eleanor Brown, “Assessing the Value of Volunteer Activity,” Nonprofit and Voluntary Sector Quarterly, 1999, 28(3): 3-17.
Also in this Issue…
