Where Does the Money Go?
Indiana Business Research Center, Kelley School of Business, Indiana University
The U.S. Bureau of Labor Statistics (BLS) has released consumer spending data for 2004, telling an interesting story of how we Americans spend our money. (1)
Average Household Expenditures on Apparel, 2004
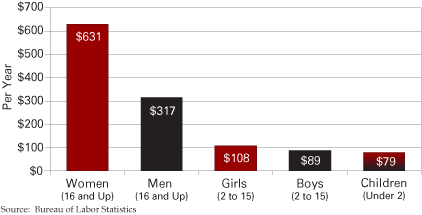
We have always believed that our spending on clothing for females is greater than that for males. From these data, we can confirm that American households spend nearly twice as much on women’s clothes than on men’s clothing. These are not per person figures, but per household.
Spending will vary by many factors. Income makes a difference in spending as does education, age, race, urban or rural setting, and region of the country. In this article, we’ll focus on differences by age.
Household Expenditures on Apparel by Age and Gender, 2004
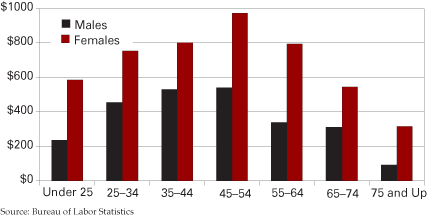
Let’s return to those expenditures for apparel. Spending for males and females both rise until we reach the 45 to 54 age group, then declines. The large difference between spending on females and males in the oldest group (75 and up) is because there are 138 women for each 100 males. In the 45 to 74 age groups, the ratio is closer to 1:1.
Housing by Age, 2004
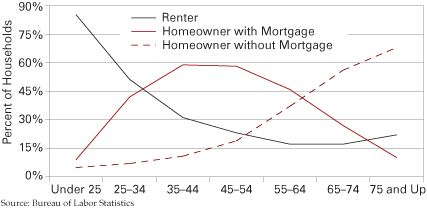
There are many differences related to age. Home ownership, as expected, rises while renting falls as we age. But as we get older, we shed our mortgages.
Household Expenditures by Age, 2004
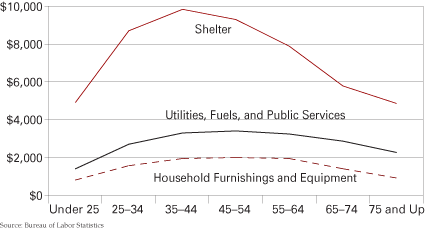
What we spend on shelter rises with age until the ages of 35 to 44. By age 65 and older, our utilities, fuels and public services are equal to almost half of our shelter costs.
Household Income Before Taxes by Age, 2004
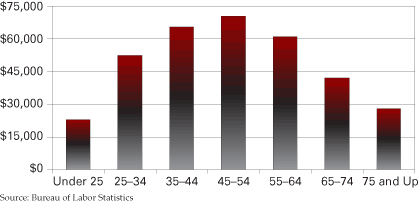
Household income also rises with age until peaking in the 45 to 54 age group.
Income Sources by Age, 2004
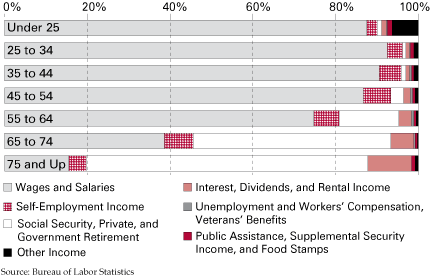
The sources of income change dramatically over time. As wages and salaries fall as a percent of income, they are replaced by Social Security, private and government pensions.
Household Food Expenditures by Age, 2004
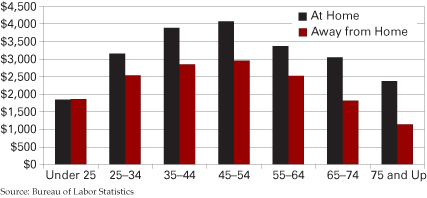
Eating away from home accounts for nearly one-third of the food expenditures of those age 75 and older. All other groups spend an even greater portion of their food dollars eating out, with the under 25 group spending half of their food dollars away from home.
Household Transportation, Health Care, and Entertainment Expenditures by Age, 2004
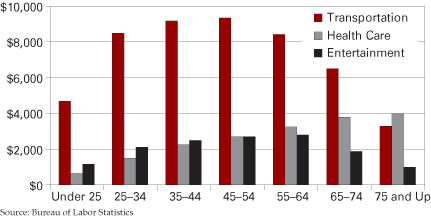
While we talk a great deal about the costs of health care, we neglect the major expenditures we make for transportation. The average household spends $7,801 on transportation and only $2,574 on health care, including insurance and drugs.
Only for those 75 and older does health care expenditures exceed transportation, yet no one discusses a transportation crisis. Entertainment spending exceeds health care spending until they are even at 45 to 54, after which health care becomes dominant.
Household Alcoholic Beverages and Tobacco Expenditures by Age, 2004
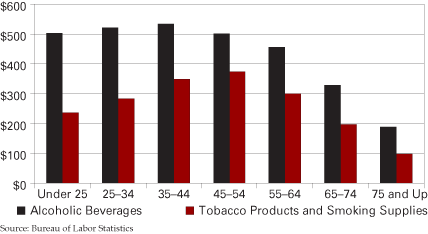
As for sin, we spend more at every age on alcoholic beverages than on tobacco products and smoking supplies.
Households by Age and Average Annual Spending, 2004
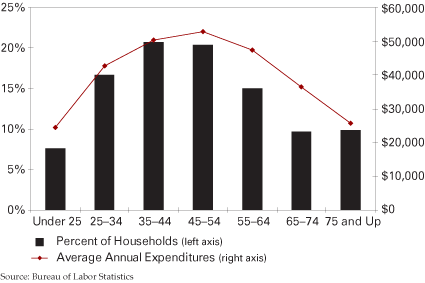
As a final note, where is the spending power? The BLS survey is a representative sample of American households. The adjacent graph shows the distribution by age. Also shown is the average annual spending per household by age. From this display of the data, it is evident that the households 75 and older will outspend those under age 25 (the 75 plus group does more spending and are more numerous than the younger group).
Percent of Household Spending by Age, 2004
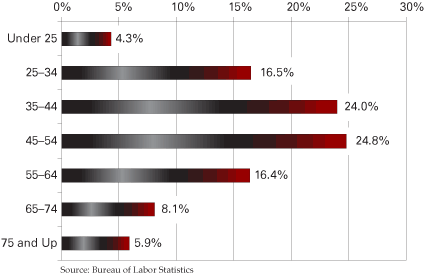
It is the 45 to 54 age group that has the most influence on the market in terms of aggregate spending. They have 20.4 percent of households compared to the 20.7 percent of their closest rivals, the 35 to 44 group, but they spend $2,300 more per household. Hence the 45 to 54 age group ends up spending 24.8 percent compared with 24.0 percent for the next younger cohort. Together the households age 35 to 54 account for almost half of all consumer spending in the United States.
Given these facts, we might be surprised by the emphasis marketing firms place on the “youth” market. Yet it is no surprise. Youthful spenders are living in those households shown here as 35 to 54. We call those spenders our children.
Notes
- Data in the Consumer Expenditure Survey are presented in terms of the “reference
person—the first member mentioned by the respondent when asked to ‘Start
with the name of the person or one of the persons who owns or rents the
home.’ It is with respect to this person that the relationship of
the other consumer unit members is determined.”
A household is defined as “(1) all members of a particular household who are related by blood, marriage, adoption, or other legal arrangements; (2) a person living alone or sharing a household with others or living as a roomer in a private home or lodging house or in permanent living quarters in a hotel or motel, but who is financially independent; or (3) two or more persons living together who use their income to make joint expenditure decisions.”


