Music City and the Circle City: A graphic companion
Indiana Business Research Center, Indiana University Kelley School of Business
For those who want to learn even more about how Indianapolis and Nashville compare, here are some metrics on the people living in these two cities.
From population to housing types and income, we cap it off with a snapshot that spans a variety of key metrics that show us both the similarities and the differences between these two large metropolitan areas.
If you have enjoyed this comparison, you can do more with the Anywhere USA profiles on StatsAmerica, where you can compare metros, micros, cities, towns and even school districts for anywhere in the country.
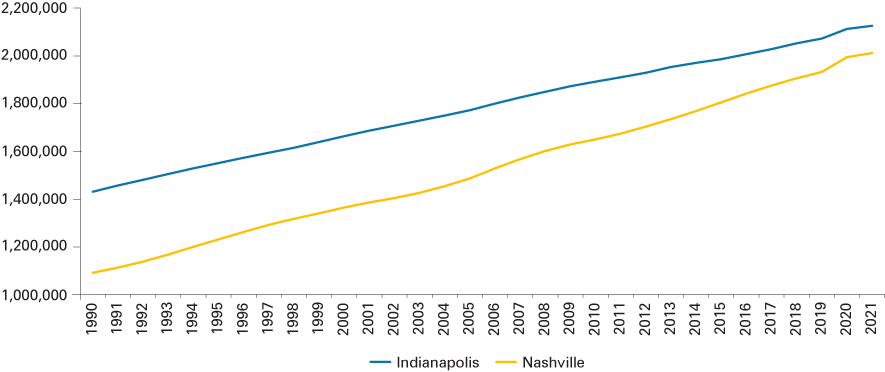
Total population, 1990-2021

Source: U.S. Census Bureau
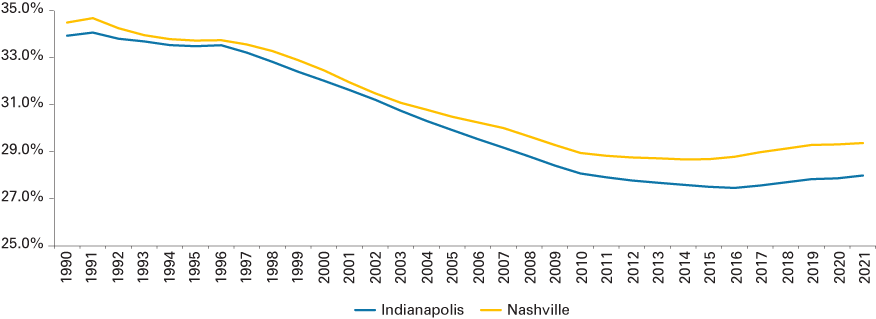
Percent of population aged 25-44, 1990-2021

Source: U.S. Census Bureau, Population by age estimates
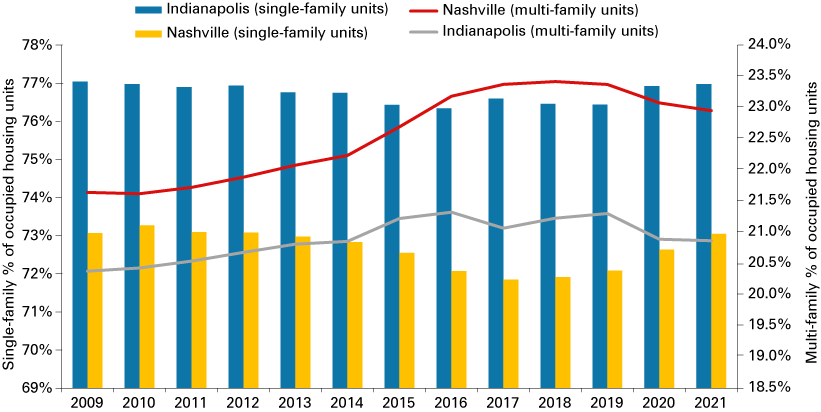
Occupied housing units by type, 2009-2021

Source: U.S. Census Bureau, American Community Survey, 5-year estimates
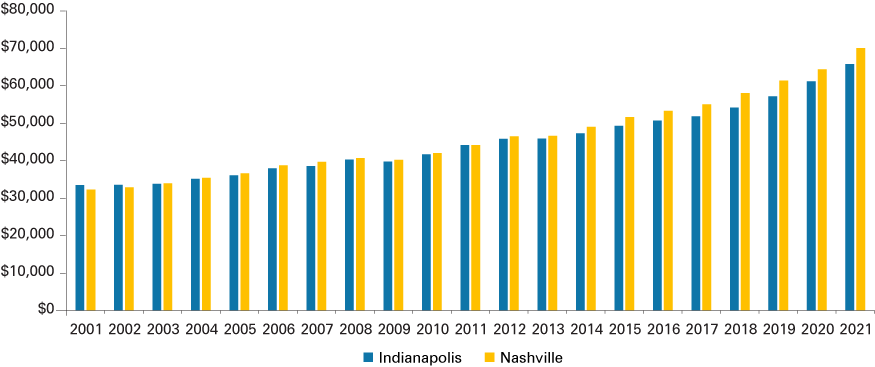
Per capita personal income, 2001-2021

Source: U.S. Bureau of Economic Analysis

| Key metrics | Indianapolis | Nashville |
|---|---|---|
| Black alone | 16.3% | 15.6% |
| White alone | 76.7% | 78.2% |
| Population ages 25 to 44 | 28.0% | 29.3% |
| Bachelor's degree or higher (population 25+) | 36.3% | 38.4% |
| Median family income | $85,612 | $88,173 |
| Child poverty rate | 15.0% | 14.6% |
| Owner-occupied housing units | 66.0% | 66.0% |
| Renter-occupied housing units | 34.0% | 34.0% |
| Median home value | $186,700 | $286,800 |
| Median gross rent | $987 | $1,211 |
| Single-family occupied housing units | 77.0% | 73.0% |
| Multi-family occupied housing units | 20.9% | 22.9% |
Source: U.S. Census Bureau, Population estimates; U.S. Census Bureau, American Community Survey, 5-year estimates (2021)


