New Albany
School of Business, Indiana University Southeast, New Albany
During 2004, the economy of southern Indiana continues to sputter. Average employment in the Louisville Metropolitan Statistical Area (MSA), and in southern Indiana in particular, continues to decrease for the fourth year in a row. Yet, indicators of consumer activity continue to improve. In this analysis, various measures of economic activity are examined in seven counties in the Louisville MSA: Clark, Floyd, Harrison, and Scott counties in southern Indiana and Bullitt, Jefferson, and Oldham counties in northern Kentucky. (1) Four additional Indiana counties—Crawford, Jefferson, Orange, and Washington—in the southern Indiana labor market area are included when data are available.
Labor Markets
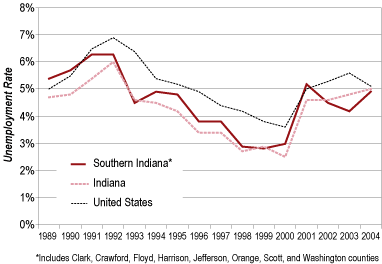
The September 2004 unemployment rates in many of the Indiana counties of the Louisville area have increased relative to the September 2003 rates. From month to month, unemployment rates in these counties are quite volatile. Figure 1 illustrates that the unemployment rates continue to fall below that of the United States. Several counties consistently have unemployment rates that are lower than the Indiana state average, with the exceptions being Crawford, Orange, and Washington counties, which consistently have unemployment rates higher than the state.
Figure 1
September Unemployment Rates
Recent data for the Louisville MSA indicates that the average level of nonagricultural employment was 559,500 for the January–September 2004 period. This is a decrease of approximately 700 jobs from the same period last year and a decline of over 30,000 jobs since 2000. Total nonagricultural employment in the southern Indiana counties averaged 93,200, a decrease of about 800 jobs over the same period last year (see Table 1) and well below the May 2001 peak of 98,200 jobs.
Table 1
Changes from 2003 to 2004 (January to September* Average)
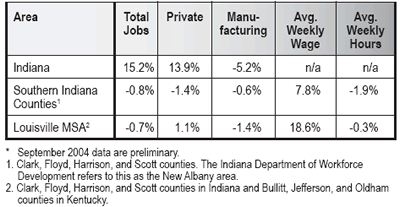
Revised employment numbers revealed that manufacturing employment in the southern Indiana counties of the metro area has been decreasing steadily over the past several years. They averaged 17,700 jobs for the January–September 2004 period, a 600 job decline over the same period in 2003. Manufacturing employment has been steadily decreasing from the January 2001 peak of 21,100 jobs. For the MSA as a whole, manufacturing employment decreased by approximately 1,400 jobs during the first three quarters of 2004. In addition to manufacturing, the trade, transportation and utilities sector in southern Indiana was hit hard over the past year, decreasing by an average of 600 jobs. Job growth was led by the wholesale trade, retail, and government sectors.
The average level of government employment increased steadily over the past few years in southern Indiana, adding approximately 600 jobs in 2004. The increase is attributable to state and local governments because federal government employment decreased.
Wages and Hours in Manufacturing
Manufacturing is the only sector for which wage and salary information is collected for the southern Indiana area. Average hourly manufacturing earnings in southern Indiana have increased over the past year but remain consistently below that of the MSA as a whole. While there is no standard measure of labor productivity for metropolitan areas, national averages suggest that labor productivity in manufacturing has increased substantially, which would boost wages.
Average weekly hours worked in the manufacturing sector averaged 41.4 hours per week for the first three quarters of 2004, which is below the 2003 average of 43.2 hours in the southern Indiana counties. Manufacturing hours peaked at 47.1 hours per week in November 2002.
Consumer Activity
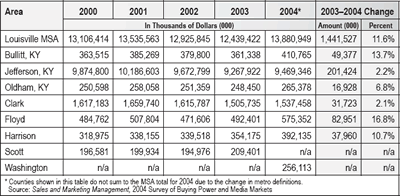
Sales and Marketing Management magazine’s 2004 survey of buying power shows a substantial increase in retail sales (see Table 2). Total retail sales in the Louisville MSA increased 11.6 percent from $12.4 billion in 2003 to $13.9 billion in 2004, surpassing the 2001 peak. Jefferson County, Kentucky, had the largest change with an increase over $201,000 between 2003 and 2004. Floyd County had substantial positive growth in retail sales, a 16.8 percent increase, while the growth in Clark County was quite modest by comparison. The increased retail spending in Floyd may indicate a redistribution of spending patterns due to new retail development in the county. Harrison County is the only county in the MSA where retail sales have increased each year for the past five years.
Table 2
Total Retail Sales, 2000 to 2004 (not adjusted for infl ation)
Click for larger image
Activity in the residential housing market continued to increase over the past year. Housing sales through October 2004 in the southern Indiana area (2) totaled 2,737 units (a 12.1 percent increase) compared with 2,441 for the January–October 2002 period. The average sales price was $131,979 for January–October 2003 sales, up just over one percent from the year before. The average amount of time for a house to sell was 98 days, a decrease over the 2003 average of 113 days.
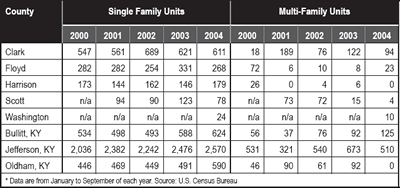
Residential construction, as measured by residential building permits for new single family residential units in the metro counties, continues to increase although at a slower rate than in the previous year. Permits for single family units increased by 3.5 percent for the January to September 2004 period. (3) (The 2003 increase was 9 percent for the same period.) In contrast, the number of multi-family unit permits decreased 24 percent. Clark, Floyd, and Scott counties experienced a decrease in single family permits from the same period in 2003, while other counties increased (see Table 3). Floyd County experienced particularly strong growth in percentage terms for multi-family permits. General interest rate increases have yet to lead to substantial increases mortgage rates, which have been seesawing over the past year. As a consequence, growth in residential building permits and home sales continues.
Table 3
Residential Building Permits Issued for Privately Owned Structures*
Click for larger image
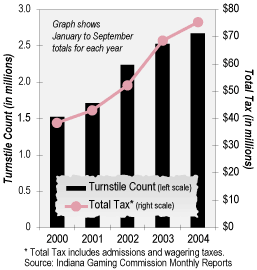
Gaming at Caesars Casino continues to attract more customers (see Figure 2). The turnstile count for January through September 2004 was over 2.6 million, a 5.7 percent increase over the same period in 2003. Tax payments totaled $75.35 million for the January–September 2004 period, a 10 percent increase over the same period in 2003.
Figure 2
Gaming at Caesars, 2000 to 2004
In 2004, the available labor market data for the Louisville and the southern Indiana area is not encouraging. Unemployment rates are quite volatile and definitely not displaying a downward trend. Average employment in the nonagricultural sector continues to decrease in the southern Indiana counties and the Louisville metro area as a whole. In contrast, indicators of consumer activity have strengthened. Retail spending in the MSA has surpassed the 2000 level and housing sales have increased relative to the previous year. Single family residential building permits remain strong. Over the coming year, the best we can hope for is continued strength in the consumer sector and a stabilized level of employment in the southern Indiana counties.
Notes
- In 2003, the federal government redefined the counties in the Louisville Metropolitan Statistical Area. They now are Clark, Floyd, Harrison, and Washington counties in southern Indiana and Bullitt, Henry, Jefferson, Meade, Nelson, Oldham, Shelby, Spencer, and Trimble counties in Kentucky. Most of the metro area statistics do not yet use the new definition; thus, I have continued to use the 1990 MSA configuration for this analysis.
- Data on home sales from the Southern Indiana Realtors Association Multiple Listing Service covers Clark, Crawford, Floyd, Harrison, Jefferson, Scott, and Washington counties.
- In January 2004, the Census Bureau began using the new metro area definitions for the building permits data.
Also in this Issue…


