Shifting Gears: Recent Changes in Indiana’s Economy
Director of Economic Analysis, Indiana Business Research Center, Kelley School of Business, Indiana University
Research Assistant, Indiana Business Research Center, Kelley School of Business, Indiana University
In the days of yore, the story for the Indiana economy started—and ended—with automobile manufacturing. Not anymore.
There have been tremendous structural changes in the global, U.S., and Indiana economies in the last decade. The economic pressures resulting from the 2001 recession accelerated many of those structural changes. To paraphrase the old car advertisement, this isn't your father's Hoosier economy.
Recently released data show that the Indiana economy has been in transition. Some industries have been growing quickly, while others have been shrinking. Output of the automobile industry—motor vehicles and parts—has grown at a rate below the rate of inflation and primary metal manufacturing has been in a slow retreat. Other industries, such as chemicals and miscellaneous manufactured products, have done fairly well. This article examines Indiana's growth patterns over the last decade and, particularly, since the end of the last recession in 2001. There is at least one clear revelation: Indiana's largest manufacturing industry isn't automobiles anymore.
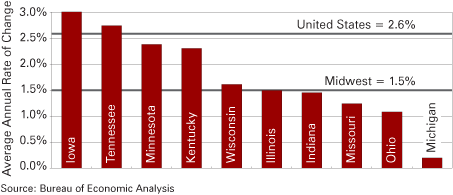
Starting with the big picture from 2001 to 2007, Indiana's real gross domestic product (GDP) rose at an average annual rate of nearly 1.5 percent, barely shy of the Midwest average and more than 1 percentage point below the U.S. growth rate, as Figure 1 shows.
Figure 1: Economic Growth in the Midwest—Percent Change in Real GDP by State, 2001 to 2007
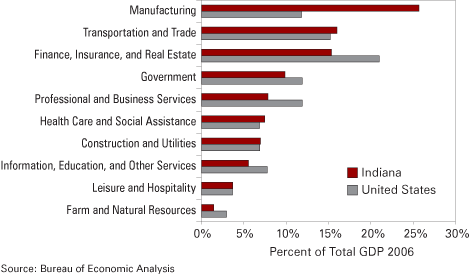
As Figure 2 and Figure 3 show, Indiana has a particularly high percentage of its GDP and employment associated with manufacturing. As a result, as the national economy has transitioned from manufacturing to higher value-added industries, Indiana was particularly vulnerable to job loss. The size of the health care sector, the construction and utilities sector, and the transportation and trade sector are about the same for Indiana and the nation. In other sectors, the differences are more dramatic. Manufacturing, for example, comprises 12 percent of U.S. output; in Indiana, manufacturing's contribution is more than twice that. On the other hand, Indiana's professional and business service sector, one of the faster growing sectors in the U.S. economy, is less than half that of Illinois and the nation.
Figure 2: Employment Concentration by Sector—Comparing Indiana to the United States
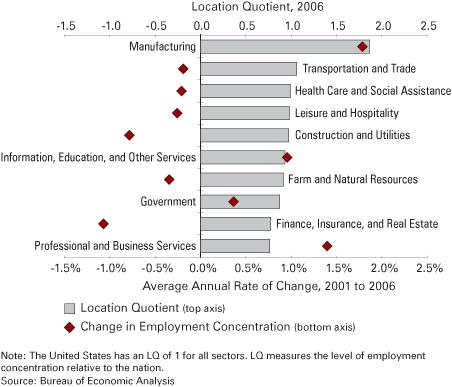
Figure 3: Percent Contribution to Current-Dollar GDP by Sector, 2006
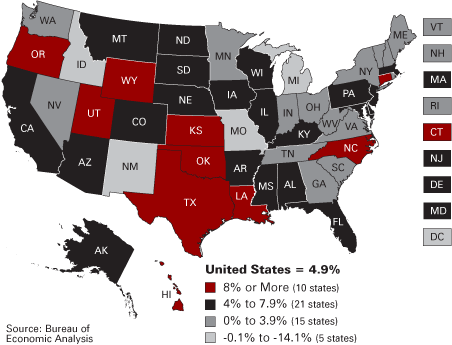
The state's industrial composition favors durable goods manufacturing. While the state's proportion of output devoted to durable goods manufacturing is the highest in the nation, Indiana's growth in durable goods manufacturing was 4.4 percentage points below the U.S. average from 2005–2007, as shown in Figure 4.
Figure 4: Average Annual Rate of Change in Current-Dollar Output for Durable Goods Manufacturing, 2005 to 2007
There are two notable bright spots within durable goods manufacturing and, to some degree, this may take the sting out of the decline in automobiles. In Indiana, other transportation equipment—boats, aerospace, and railroad equipment—current-dollar output grew by more than 10 percent at an average annual rate from 2001 to 2006.1 The life sciences also have something to boast about. Miscellaneous manufacturing—which includes the manufacture of medical devices— current-dollar output increased nearly 5 percent at an average annual rate from 2001 to 2006, although overall output growth in 2006 slowed from 2005.
Nondurable goods manufacturing is about half the size of durable goods manufacturing in Indiana. As was the case for durable goods manufacturing, from 2005 to 2007, Indiana inhabited the bottom quintile of states in the growth of the nondurable sector, as shown in Figure 5.
Figure 5: Average Annual Rate of Change in Current-Dollar Output for Nondurable Goods Manufacturing, 2005 to 2007
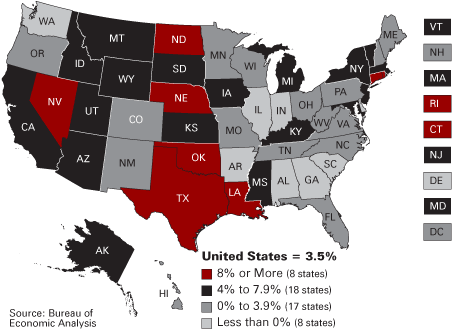
Table 1 presents the transformation of Indiana manufacturing output in the last decade. While the automobile industry has remained constant as a percent of Indiana's manufacturing sector, it has been eclipsed by chemical manufacturing. That's right: in 2006, Indiana's production of chemical products—including pharmaceuticals—was greater than motor vehicles and parts.
Table 1: Indiana's Manufacturing Sector Composition, 1997 and 2006
| Industry | Percent of Manufacturing GDP |
|
1997 |
2006 |
|
| Chemicals | 15.8 | 19.7 |
| Motor Vehicles and Parts | 17.4 | 17.2 |
| Fabricated Metals | 9.1 | 9.3 |
| Miscellaneous | 5.1 | 8.2 |
| Machinery | 8.1 | 7.7 |
| Primary Metals | 11.7 | 7.1 |
| Plastics and Rubber | 5.6 | 5.6 |
| Food Products | 5.8 | 5.0 |
| Other Transportation Equipment | 1.7 | 3.0 |
| Computers and Electronics | 2.5 | 2.7 |
| Furniture and Related Products | 2.7 | 2.6 |
| Nonmetallic Minerals | 2.7 | 2.4 |
| Printing | 2.7 | 2.2 |
| Petroleum and Coal Products Manufacturing | 1.2 | 2.1 |
| Wood Product Manufacturing | 2.1 | 1.8 |
| Electrical Equipment and Appliance Manufacturing | 3.6 | 1.7 |
| Paper Manufacturing | 1.6 | 1.4 |
| Textile and Textile Product Mills | 0.3 | 0.2 |
| Apparel Manufacturing | 0.2 | 0.2 |
Source: Bureau of Economic Analysis
This revelation may come as something of a surprise. The nature of the data used to track industry performance may explain why this fact may not be well known. Figure 6 shows the output changes for the two industries over time. The solid lines plot current-dollar output, or economic output in the prices and quantities of the year. The dotted lines plot real or chained-dollar output. This measure is based in the year 2000 and reflects changes in prices so that increases in prices aren't confused for increases in economic production as one analyzes trends over time. Current-dollar output for a particular year is inflated or deflated using price indexes that are custom-made for each industry to derive real chained-dollar output. In other, less precise words, the real chained-dollar output (GDP) measure has been adjusted for inflation.
Figure 6: Indiana Chemical and Motor Vehicle Manufacturing, Current- vs. Chained-Dollar GDP, 1997 to 2006
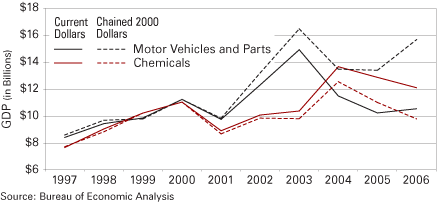
There is a potential problem, however, by over-reliance on the real chained-dollar measure. The chained index takes into account changes in prices, but it also accounts for changes in product quality and features. Computers are a classic example: prices have fallen while features and capabilities have expanded. As a result, computer output measured in current dollars has increased at an average annual rate of 9.5 percent since 2001 in Indiana, but real chained-dollar output has increased at an average annual rate of 23.1 percent since 2001. The reason the real measure is over twice that of the current "dollars of the day" measure is that, even if output and prices stayed constant over the period, computers got better and that is reflected in the price index used to calculate the real chained-dollar measure.
That 2006 chemical manufacturing output is greater than automotive output is evidence that Indiana's manufacturing is restructuring. The output of motor vehicles and parts, as a proportion of Indiana's GDP, fell from 5 percent to 4.4 percent from 2001 to 2006. Primary metal manufacturing output has been trending downward as well, falling to 1.8 percent in 2006 from 2.5 percent in 2001 and 3.4 percent in 1997. Meanwhile, chemical manufacturing, as a proportion of state GDP, has fluctuated over the last decade and stood at 5.1 percent of state output in 2006.
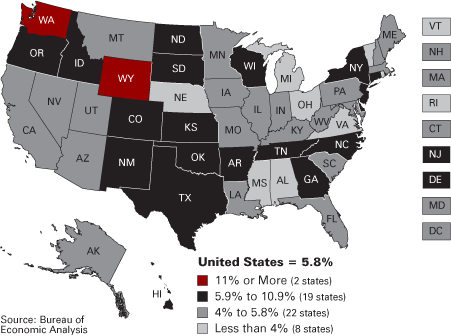
On the service sector front, Indiana has not kept pace with the nation or its Midwestern neighbors. For two of the fastest growing sectors—namely, professional and business services and information, education, and other services—Indiana's growth rate is below the national average, as Figures 7 and 8 show. Indiana's professional and business service sector is relatively small and, if one may hazard a forecast, will likely remain so given that its growth rate is below the national average.
Figure 7: Average Annual Rate of Change in Current-Dollar Output for Professional and Business Services, 2005 to 2007
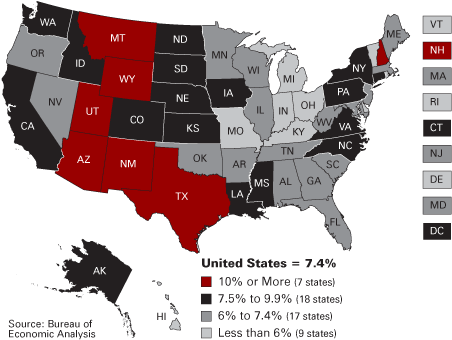
Figure 8: Average Annual Rate of Change in Current-Dollar Output in Information, Education, and Other Services, 2005 to 2007
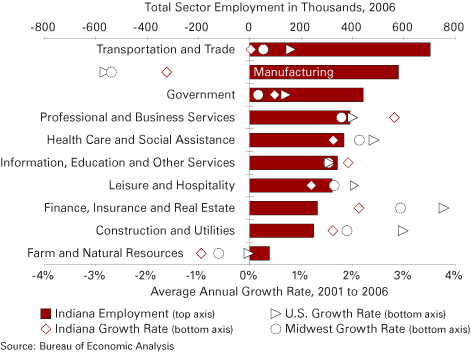
While average output growth in professional and business services has been lackluster, the sector's employment gains were the best in the state. From 2001 to 2006, employment grew at an average annual rate of 2.8 percent. Employment gains in information, education, and other services were also above average, as Figure 9 shows.
Figure 9: Employment Growth by Sector, 2001 to 2006
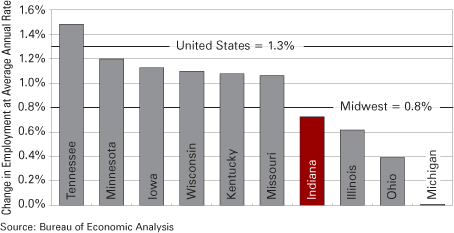
As Figure 10 shows, the fortunes of change in output and employment do not always march in lockstep. The growth of Indiana's economic output—and the transition from one industry to another—has been inconsistent and the employment growth has likewise been rocky. Figure 11 shows that Indiana's employment performance is at the lower end of the Midwest. Only Illinois and fellow motor vehicles and parts behemoths Ohio and Michigan fared worse. Given Indiana's dependence on manufacturing—and that sector's recent performance—the employment figures are not unexpected.
Figure 10: Real Output vs. Employment in Indiana, 2006
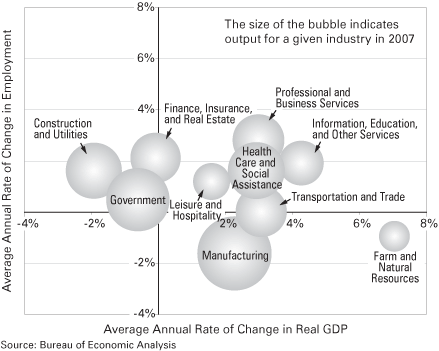
Figure 11: Employment Growth in the Midwest, 2001 to 2006
Indiana has a high location quotient in manufacturing and has increased its advantage since 2001 (refer again to Figure 2). It may be important to note that the state has not gained jobs but rather lost fewer jobs than the rest of nation. Indeed, Indiana's employment dynamics in the chemical and motor vehicles and parts industries have bucked the national trends, as Figure 12 and Figure 13 show. Indiana didn't hemorrhage jobs in motor vehicles and parts like the nation as a whole. Instead, employment stabilized after the recession. In chemical manufacturing, the employment trends for the United States and Indiana have also diverged.
Figure 12: Chemical Manufacturing Employment Trends—Comparing Indiana to the United States, 1997 to 2006
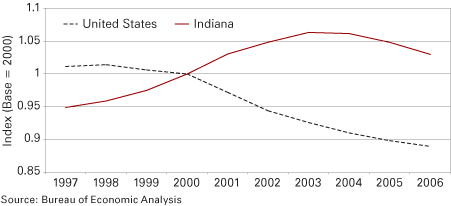
Figure 13: Motor Vehicles and Parts Employment Trends—Comparing Indiana to the United States, 1997 to 2006
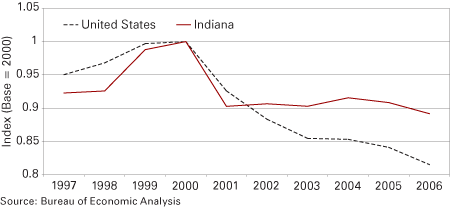
The state also registers a location quotient greater than one for transportation and trade, a sector that serves manufacturing. In some advanced service industries, such as information and education and professional and business services, the state is gaining concentration, though it still lags behind the rest of the nation. In finance, insurance, and real estate, another important service industry, Indiana is behind and is not catching up.
Figure 14 charts the manufacturing industries that saw the biggest numeric gains in current-dollar GDP from 2001 to 2006 together with changes in employment. Despite a barrage of bad news about the auto industry in recent years, Indiana has not lost as many jobs in motor vehicle manufacturing as its neighbors in either absolute numbers or in percentage terms. Michigan and Ohio, for example, lost 92,000 and 24,000 jobs, respectively, from 2001 to 2006 in this sector. This translates to average annual decreases of 7.1 percent and 3.4 percent, respectively.
Figure 14: Trends in Indiana Manufacturing Industries with Largest Increases in Output, 2001 to 2006
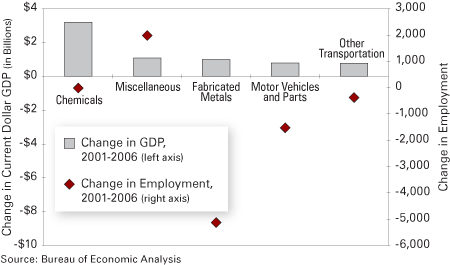
Even more encouraging is the performance of advanced manufacturing industries. Figure 14 displays the growth in chemicals and miscellaneous manufacturing, among the other top five growth industries. While computers and electronics manufacturing didn't make it into the top five, it did rank seventh in output growth since 2001. These three industries tend to be knowledge-intensive and may provide greater opportunities for growth. In particular, Indiana's continued focus on life sciences makes it a fertile place to cultivate advanced manufacturing in pharmaceuticals and medical devices.
According to data from the Census Bureau's County Business Patterns, Indiana registered an employment location quotient of 2.07 in 2006 for pharmaceutical and medicine manufacturing. Indiana is third in the nation behind New Jersey and Delaware. The state ranks fourth for medical equipment and supplies manufacturing, with a location quotient of 2.16.
Life sciences and electronics manufacturing provides one way for Indiana to capitalize on its manufacturing resources and translate them into higher paying jobs. Data from the National Science Foundation show that in 2005, the latest year for which data are available, manufacturing industries accounted for 70 percent of total research and development spending. The majority of this research and development was concentrated in chemical manufacturing and, more specifically, pharmaceuticals and medicines. As a national leader in these industries, Indiana stands to gain.
It is difficult to imagine an economic story for Indiana that doesn't center on automobile manufacturing. But, to Indiana's benefit, that story is being rewritten. The future depends on the state's ability to refocus its comparative advantages toward advanced manufactures.


