Gary
Indiana University Northwest, Gary
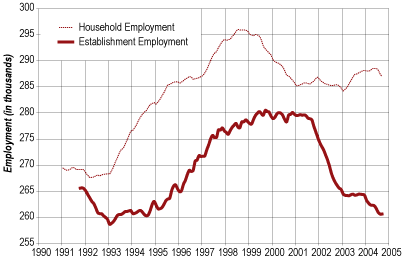
The northwest Indiana economy has not performed well over the past three years. Establishment employment (1) peaked in September 1999, a level that was maintained with little change until September 2001. Since September 2001, establishment employment has declined by about 7 percent (see Figure 1). (2) It stabilized at about 264,000 throughout 2003 but has declined again in 2004. Household employment (3) peaked nearly two years earlier and was, in fact, roughly stable throughout 2001 and 2002, rose somewhat during 2003, and recently began to decline. The difference in the patterns of establishment employment and household employment mirrors, although not precisely, similar developments at the national level. (4)
Figure 1
Total Employment in Northwest Indiana (Twelve-Month Moving Average)

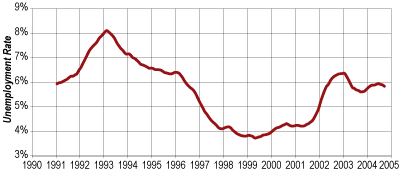
The unemployment rate fell steadily throughout the 1993 to 1998 period and began to rise noticeably near the middle of 2001 (see Figure 2). It has been mostly stable (between 5.5 percent and 6 percent) during the past year.
Figure 2
Northwest Indiana Unemployment Rate (Twelve-Month Moving Average)

The recent monthly changes in employment and the unemployment rate do not suggest that robust growth will occur in the immediate future. While establishment employment was higher in September than in July and August, that has occurred largely because of the return of elementary and secondary teachers to the classroom (they are not counted as employed during the summer), and employment remains below its September 2003 level by about 1 percent. (Employment has been lower than the year-earlier level in most months in 2004.) The unemployment rate has continued its usual pattern of rising in January and falling through the spring. The normal pattern has been for the unemployment rate to “bottom out” in September or October and rise during the holiday season (as people seek seasonal employment).
It seems unlikely that the local economy will experience rapid employment growth over the next twelve months. Indeed, a further decline appears more likely than any substantial growth. Over the past twelve months (to September 2004), establishment employment has averaged about 261,000. That seems a likely average over the next twelve months as well (my sector-by-sector analysis suggests a gain of perhaps 700 to 1,000 jobs). Household employment has averaged about 287,000, but has been trending slightly downward. Again, stability at about 287,000 seems more likely than growth, although the recent downward trend should be a concern. The unemployment rate has averaged about 5.9 percent over the past twelve months. A stable unemployment rate also seems likely over the next year.
The Goods-Producing Industries
Construction: Construction has been a local bright spot. Despite strong seasonal fluctuations, employment in construction has increased by nearly 2,000 jobs since the middle of 2001 (about 12 percent total, or about 4 percent per year). This increase seems plausible in light of the continued strength of residential construction in northwest Indiana and the ongoing highway construction projects throughout the region. It seems likely that construction employment will grow by 4 percent over the next year, a gain of about 700 jobs.
Manufacturing: Between the beginning of 2001 and the beginning of 2004, northwest Indiana lost about 7,200 manufacturing jobs (a 16 percent decline—about 5 percent per year). In 2004, however, manufacturing employment appears to have stabilized at around 37,000 and durable goods manufacturing has shown very slight growth (gaining about 400 jobs during the year). Even employment in steel has stabilized at about 19,000 jobs. Considering the declines in manufacturing over the prior three years, this is, perhaps, a better-than-expected set of numbers.
The strength of the steel industry, manifested in stable employment and continued growth in output, will continue as long as the world steel market remains strong. However, the Chinese central bank recently increased interest rates, which may lead to a slowing of growth in China and a moderation in Chinese demand for steel. Over the longer term, as China adds to its steel capacity, their demand for imported steel may stabilize or decline. This will almost certainly lead, by the end of this decade, to another period of excess capacity worldwide, with resulting downward pressure on steel prices and profits.
The merger of ISPAT-Inland and ISG (to form Mittal Steel) is unlikely to have any immediate consequences for northwest Indiana. As long as world demand remains strong, the merged company will find uses for all its capacity and output, and employment in northwest Indiana will not decline. There might be extremely modest reductions in management positions here, and perhaps larger reductions in Chicago, but these will not have any large consequences for northwest Indiana.
By the end of the decade, however, as China’s new capacity comes on line, things may well be different. Should world demand cease to grow and should steel prices decline, then all steel manufacturers will begin to look again at their capacity and their facilities. Older, less technically advanced and productive facilities will then be at risk of output reductions or closings. The implications of that for northwest Indiana are not clear at this time.
So long as steel demand remains strong, manufacturing employment in northwest Indiana is likely to hold its own. Any significant growth in employment, however, seems unlikely.
Service Industries
Total employment in the service industries has varied widely within each year over the past four years. Average employment seems to have been about 205,000, with no particular trend, although service sector employment has typically been stronger in the second half of the year. It is perhaps more useful to look at the major subsectors in services.
Wholesale Trade: Employment in wholesale trade has declined by about 10 percent over the past three years, and it appears likely to lose another 200 or so jobs in the next year. While I cannot find any specific explanations for this development, the trend is quite clear and apparently quite strong.
Retail Trade: Employment in the retail sector has declined about 3 percent over the past three years, almost entirely between mid-2001 and mid-2002. It has stabilized since then, with the usual seasonal fluctuations (rising in the fourth quarter). Stable employment here, of around 32,500 jobs, seems likely.
Transportation and Utilities: Employment in this sector displays a strong within-year pattern, with employment falling dramatically from December to January, then rising slowly throughout the year. Unfortunately, employment has ended each year (2001, 2002, 2003) below the previous year’s level. The decline appears to be about 400 jobs per year, so a decline to an annual average of about 11,600 jobs seems in keeping with our recent history. Part of this has been driven by productivity gains in trucking and electric power generation and distribution.
Business and Professional Services: Another bright spot. Employment has increased from about 20,500 in mid-2001 to about 22,000 in mid-2004 (up 7.3 percent, or about 2.4 percent per year). A continuation of growth here would add about 500 jobs.
Education, Health, and Human Services: Employment has increased by about 3 percent over three years (about 1,000 jobs). The gain appears to be about equally split between education (This is private-sector education at all levels, elementary through higher education. Public education shows up in the government sector.) and health and human services, but it’s about a 10 percent employment gain in education and a less than 2 percent increase in health and human services.
Within health and human services, hospital employment rose by about 6 percent between 2001 and the end of 2003, but has since fallen back to its prior level.
Employment gains in the health sector are likely to become harder to achieve, as more attention is paid to health care costs. As a result, only continued growth in private education is likely to provide employment gains here. A net gain of about 300 jobs in this sector seems to be about the limit.
Leisure and Hospitality Services: This sector includes casinos, eating and drinking establishments, theaters, and hotels/motels. The trend over the past three years is slightly up, with a net gain of about 500 jobs (about 1.6 percent total). This industry also shows substantial within-year variation, generally peaking in the summer and bottoming out in the winter. Gains of about 150 jobs over the next year seem likely.
Other Service Employment: Additional service sectors include the information sector (publishing, telecommunications, internet services, etc.), financial services, and miscellaneous services. Employment in information services has been declining by about 200 per year. This may well continue, as some consolidation takes place and as productivity rises. Both financial services and miscellaneous services have experienced little employment change over the past three years, a pattern that is likely to continue. However, should additional locally owned banks be acquired by national banks seeking a northwest Indiana presence, some declines in banking employment may occur.
What may be an important change has occurred in the banking sector of the local economy and deserves mention. Mercantile National Bank, a locally owned bank with a record of commitment to northwest Indiana, has been acquired by Harris Bank (based in Chicago, a subsidiary of BOM, Ltd., a Canadian bank holding company whose largest bank is the Bank of Montreal). There is substantial research indicating that when locally owned banks are purchased by banks with a national or international presence, their focus on local depositors and local borrowers diminishes. As a result, a long-run consequence of this acquisition may be reduced access to bank credit for local small businesses.
Summary: The sectoral analyses suggest a net gain of around 150 jobs in services over the next year. Compared with the nation, or with the historical trends in northwest Indiana, this is a fairly weak performance.
Government
Little change has occurred in government employment in the past three years. Federal government employment has remained roughly constant at about 2,000 jobs. The state of Indiana has reduced its employment in the region by about 100 jobs. Local government, including local public (elementary and secondary) education has remained at about 32,000 jobs. I foresee no change here.
Conclusions
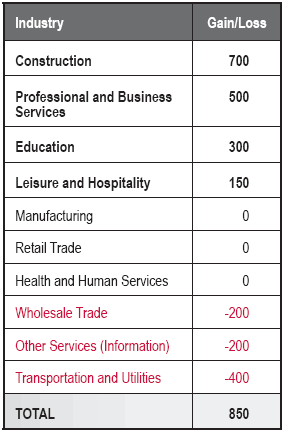
The sector-by-sector analysis points to a gain of around 0.3 percent, or about 850 jobs (see Table 1). It seems fair to say that we can expect little employment growth during the coming year.
Table 1
Northwest Indiana Forecasted
Employment Gains and Losses for 2005

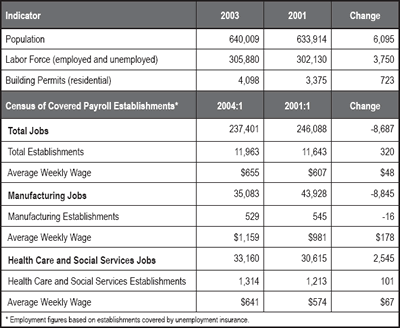
These projections are contingent on a national economy that continues to perform reasonably well, with output gains in the 3.5 percent to 4 percent range. Slowing of the national economy (as a result of rising interest rates or another negative shock) will, obviously, have a negative impact on northwest Indiana. The coming year does not seem likely to be one of robust growth in employment for the region. As a consequence, we should expect very restrained income growth as well. Unemployment should hold steady at around 6 percent, and the local labor force will also probably remain unchanged (see Table 2).
Table 2
Key Indicators for Northwest Indiana
Click for larger image
Notes
- Establishment employment measures the number of jobs provided by employers in northwest Indiana (Lake and Porter counties), regardless of where the people employed live. Establishment employment data are drawn from reports of the Indiana Department of Workforce Development and the U.S. Bureau of Labor Statistics (www.bls.gov).
- The discussion of total employment and unemployment rates uses a twelve-month moving average of monthly employment data. This smooths month-to-month variability and helps account for seasonal fluctuations.
- Household employment is an estimate of the number of people living in northwest Indiana who hold jobs, regardless of where those jobs are located. Data on household employment and unemployment come from the Local Area Unemployment Statistics program of the U.S. Bureau of Labor Statistics (www.bls.gov).
- At the national level, part of the discussion about these differences has focused on new business start-ups and the self-employed. In northwest Indiana, it might be more readily explained by changes in the number of people holding jobs, for example, in Illinois.
Also in this Issue…


