South Bend and Elkhart forecast 2023

Director of the Bureau of Business and Economic Research and Professor of Economics, Judd Leighton School of Business and Economics, Indiana University South Bend
Both the South Bend-Mishawaka and Elkhart-Goshen MSAs had a prosperous 2022, with expanded labor forces, higher employment numbers and impressively low unemployment rates. The tight labor market is associated with higher labor cost in both areas. In addition, St. Joseph County housing prices continued to rise, though new single-family home construction and existing home sales softened.
Labor force and employment
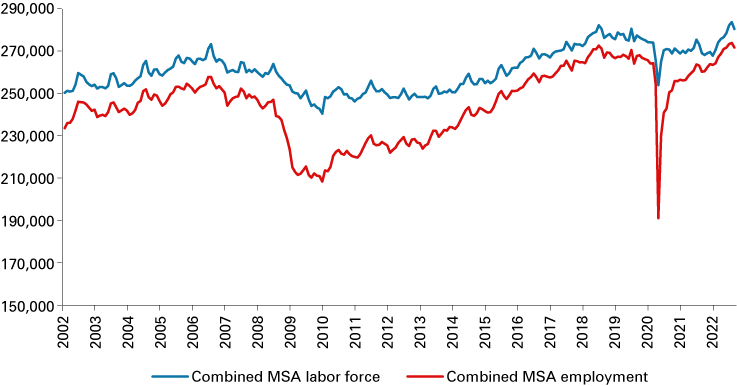
According to the U.S. Bureau of Labor Statistics, the labor force in the combined South Bend-Mishawaka and Elkhart-Goshen MSAs averaged 277,364 in the first eight months of 2022, an increase of 6,513 from the same time period last year.1 Figure 1 displays the monthly trends of the labor force and employment of the combined region.2 The labor force increased by 1,489 in the South Bend-Mishawaka MSA and 5,023 in the Elkhart-Goshen MSA.3 Compared to the pre-pandemic level, South Bend-Mishawaka’s labor force is still 6,659 below the 2019 figure, whereas Elkhart-Goshen’s labor force has surpassed the 2019 figure by 7,144.4
The average employment in the combined region was 269,884 in the first eight months of 2022, 10,349 more than the same time period in 2021 (+4.0%). The South Bend-Mishawaka MSA created 4,273 more jobs (+2.9%) and the Elkhart-Goshen MSA added 6,076 jobs (+5.4%). The state and national employment growth rates from 2021 to 2022 were 3.0% and 4.4%, respectively. The Elkhart-Goshen MSA once again outperformed Indiana and the nation in terms of job growth. The South Bend-Mishawaka MSA’s employment growth rate was similar to that of the state, but fell behind the national rate.
Figure 1: Labor force and employment in the South Bend-Mishawaka and Elkhart-Goshen MSAs combined

Note: Data are shown through August 2022 and are not seasonally adjusted.
Source: STATS Indiana, using U.S. Bureau of Labor Statistics data
Unemployment
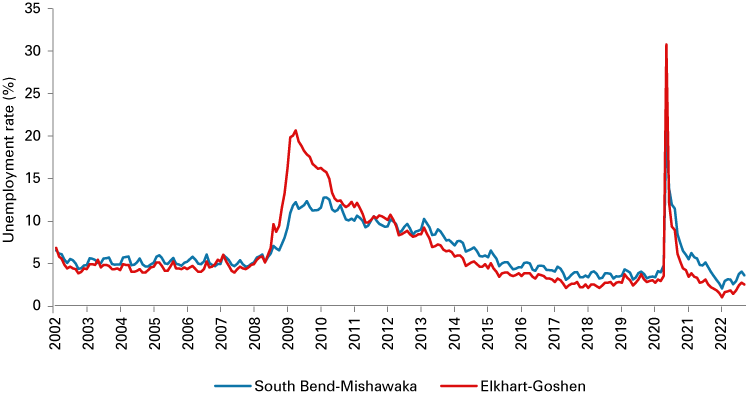
The unemployment rate continued to decline in both metropolitan areas in 2022. Figure 2 traces the South Bend-Mishawaka and Elkhart-Goshen MSAs’ unemployment rates from January 2002 to August 2022. The average unemployment rate in the South Bend-Mishawaka MSA was 3.2% in 2022, a decrease from the 2021 rate of 5.1%. The South Bend-Mishawaka unemployment rate has even dropped below the pre-pandemic rate of 3.8% in 2019. Elkhart-Goshen’s jobless rate was 2.0% in 2022, one percentage point lower than the 2021 rate and 1.1 percentage points below the pre-pandemic unemployment rate of 3.1% in 2019. Not only was Elkhart-Goshen’s unemployment rate far below the state and national rates (2.8% for Indiana and 3.8% for the U.S.), but it also reached its lowest point since 1990. Meanwhile, South Bend-Mishawaka’s unemployment rate was 0.4 percentage points higher than the state jobless rate, but 0.6 percentage points below the national rate. This is also the lowest unemployment rate in the South Bend-Mishawaka MSA since 2001.
Figure 2: Unemployment rate in the South Bend-Mishawaka and Elkhart-Goshen MSAs

Note: Data are shown through August 2022 and are not seasonally adjusted.
Source: STATS Indiana, using U.S. Bureau of Labor Statistics data
Employment by industry
Based on the business establishment survey from the Bureau of Labor Statistics, the total nonfarm employment in the South Bend-Mishawaka MSA averaged 136,575 between January and August 2022, up 2,938 jobs (+2.2%) from the same time period in 2021.5,6 Table 1 presents the sectoral employment in 2022 and the change since 2021. It is worth noting that the total nonfarm employment in 2022 is still 9,650 below the 2019 level. All sectors experienced job growth, except private educational and health services. This job growth was led by the leisure and hospitality industry (+1,238), followed by professional and business services (+588); manufacturing (+400); and natural resources, mining and construction (+388). Smaller job growth was also experienced in trade, transportation and utilities; information; financial activities; other services; and government. The private educational and health services industry lost 288 jobs in 2022.
The total nonfarm employment in the Elkhart-Goshen MSA averaged 147,850 between January and August 2022, 5.2% above its 2021 level and 7.2% higher than the pre-pandemic figure in 2019.7 Many sectors saw employment growth, led by manufacturing (+5,888 jobs) and followed by trade, transportation and utilities (+513); professional and business services (+438); and leisure and hospitality (+275). Smaller job gains were experienced in natural resources, mining and construction; private educational and health services; information; and other services. Financial activities and government lost 25 and 100 jobs, respectively, in 2022.
Table 1: Year-to-date employment by industry and metro area
Industry |
South Bend-Mishawaka | Elkhart-Goshen | ||
|---|---|---|---|---|
| Employment in 2022 | Change since 2021 | Employment in 2022 | Change since 2021 | |
| Total nonfarm | 136,575 | 2,938 | 147,850 | 7,350 |
| Natural resources, mining and construction | 6,050 | 388 | 4,100 | 163 |
| Manufacturing | 15,888 | 400 | 77,913 | 5,888 |
| Trade, transportation and utilities | 25,663 | 63 | 20,625 | 513 |
| Information | 1,400 | 13 | 400 | 25 |
| Financial activities | 6,050 | 75 | 2,850 | -25 |
| Professional and business services | 14,225 | 588 | 10,900 | 438 |
| Private educational and health services | 33,438 | -288 | 11,613 | 50 |
| Leisure and hospitality | 14,000 | 1,238 | 6,950 | 275 |
| Other services | 5,225 | 275 | 4,325 | 125 |
| Government (includes public schools and hospitals) | 14,638 | 188 | 8,175 | -100 |
Note: Data are for January through August 2022.
Source: STATS Indiana, using Current Employment Statistics (CES) data from the U.S. Bureau of Labor Statistics
Local wages and hours worked
Both MSAs’ labor costs continued to rise in 2022. Average hourly earnings for the private sector increased by 5.1% to $27.80 in South Bend-Mishawaka and by 16.5% to $30.0 in Elkhart-Goshen. The average workweek declined by 2.1% to 34.1 hours in South Bend-Mishawaka, but increased by 3.1% to 37.3 hours in Elkhart-Goshen. As a result, the average weekly earnings increased by 2.9% to $946.90 in South Bend-Mishawaka and by 20.0% to $1,118.70 in Elkhart-Goshen.
Housing
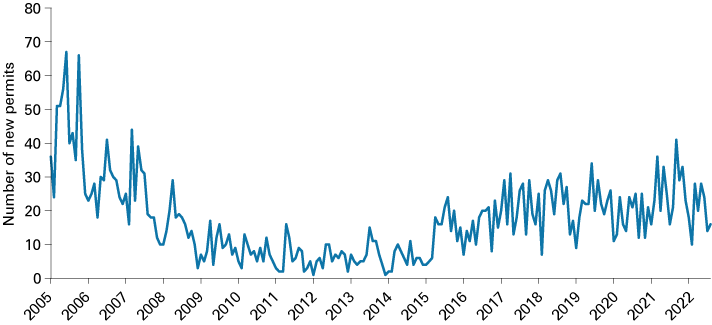
The local housing market seemed to slow down in 2022. First, St. Joseph County issued 158 new single-family building permits between January and August 2022. This figure was down 16.8% from last year and 10.7% from the pre-pandemic 2019 level. Figure 3 illustrates the single-family residential building permits issued in St. Joseph County from January 2005 to August 2022. Second, the Indiana Association of Realtors statistics indicated that new listings of existing homes in St. Joseph County decreased by 3.8% and closed sales were down 8.1% between January and August 2022.8 However, the median sales price jumped 16.3% in 2022, the most significant increase since 2009.
Figure 3: Single-family residential building permits in St. Joseph County

Note: Data are shown through August 2022.
Source: St. Joseph County Building Department
Summary
Although 2022 was a good year for the local economy, economic prospects are gloomy looking ahead to 2023. Economic risks come from the high inflation rate and tightening monetary policy domestically, as well as rising energy prices, Russia’s war against Ukraine and the possibility of further pandemic-related supply-side disruptions globally, creating additional upward pressure on inflation.
According to the Bureau of Labor Statistics, the U.S. monthly inflation rate was 0.4% and the annual inflation rate was 8.2% in September 2022. The U.S. inflation rate has been above 7% since December 2021. This persistent inflation has encouraged more hawkish monetary policy by the Federal Reserve. The baseline interest rate, the federal funds rate, rose from 0.08% at the beginning of 2022 to 3.08% in October, the highest it has been in 14 years.9,10 It is probable that the federal funds rate will continue to increase in the rest of 2022 and in 2023.
According to the economic projections published by the Federal Reserve Bank, the majority of policymakers see the federal funds target rate as between 4.4% and 4.9% in 2023 (FOMC, September 2022).11 Contractionary monetary policy and easing supply-side constraints hopefully can help cool inflation down over the coming quarters. However, the rising interest rate will suppress consumer demand and investment activities, which will tip the U.S. economy into a broad-based recession in 2023 (The Conference Board, October 2022).12 Consequently, this contraction will impact local labor markets and drive the unemployment rate higher. The South Bend-Mishawaka MSA unemployment rate in 2023 is predicted to rise to between 4.5% and 4.75%. Federal Reserve policymakers projected in September 2022 that the median unemployment rate will be 4.4% in the U.S. in 2023 with a central tendency of 4.1% to 4.5%. This number is much higher than the average U.S. unemployment rate in the first eight months of 2022. The South Bend-Mishawaka MSA has a higher share of manufacturing employment (11.6% relative to 8.4% at the national average) that could drive the local unemployment rate above the national average when the economy contracts.
We will also likely see more retreats in the St. Joseph housing market in 2023. The higher borrowing cost and historically high housing prices have slashed the building of new homes and sales of existing homes in the summer of 2022. Moving into 2023, the stubborn high inflation rate and rising interest rate increase the uncertainty of home buyers’ capacity to pay the mortgage. The colliding impacts of those economic pressures will keep more home buyers out of the housing market, which will further dwarf new home construction and existing home sales and might also halt rising home prices.
The Elkhart-Goshen MSA’s unemployment rate could move up to between 5.5% and 6.0% in 2023, given the dominant role of the RV industry in its economy. The aforementioned economic headwinds, such as the elevated interest rate, the high inflation rate, high energy prices and intensified uncertainty in 2023, could turn consumers away from buying durable goods, like RVs. According to the RV Industry Association’s August report, total RV shipments were 33,783 units, down 36% from the 52,819 units shipped in August 2021, and the cumulative shipments through July 2022 were 2.6% below the 2021 level.13
This figure is back to the pre-pandemic August 2019 level. As the RV industry is highly cyclical, the possibility of massive layoffs is high if the economy moves into recession, which could quickly raise the local unemployment rate.
Notes
- The labor statistics used in this article, including labor force, employment, unemployment, unemployment rate and employment and earnings by industries, are averages of January to August for each year. August 2022 data are preliminary.
- Labor force and employment data are available at STATS Indiana: www.stats.indiana.edu/laus/laus_view3.html.
- The average labor force in the South Bend-Mishawaka MSA was 156,510 in 2022 and 155,021 in 2021. The average labor force in the Elkhart-Goshen MSA was 120,853 in 2022 and 115,830 in 2021.
- The average labor force in 2019 was 163,169 for the South Bend-Mishawaka MSA and 113,709 for the Elkhart-Goshen MSA.
- Total nonfarm employment and the sectoral employment come from the Current Employment Statistics (CES) of the U.S. Bureau of Labor Statistics. https://www.stats.indiana.edu/ces/ces_naics/
- In 2021, the average January-to-August total nonfarm employment was 133,638 for the South Bend-Mishawaka MSA.
- Elkhart-Goshen MSA’s total nonfarm employment was 140,500 in 2021 and 137,975 in 2019.
- Source: Indiana Housing Market Update, August 2022.
- Data on the federal funds rate were retrieved from FRED, the Federal Reserve Bank of St. Louis, https://fred.stlouisfed.org/series/DFF. In January 2008, the federal funds rate was 3.06%, comparable to the current rate. Then, the federal funds rate decreased to around 2% in mid-2008 and to 0.09% by December 2008.
- The federal funds rate is the central interest rate in the U.S. financial market. It influences many other interest rates, such as the prime rate, which is the rate banks charge their customers with higher credit ratings, and interest rates of mortgages, loans and savings, all of which are critical to consumer wealth and confidence (FRED, the Federal Reserve Bank of St. Louis, https://fred.stlouisfed.org/series/DFF). Thus, the changes in the federal funds rate affect the demand side of the U.S. economy.
- “Summary of Economic Projections,” Federal Open Market Committee, September 21, 2022, https://www.federalreserve.gov/monetarypolicy/files/fomcprojtabl20220921.pdf, retrieved on October 20, 2022.
- “Economic Forecast for the U.S. Economy,” The Conference Board, October 12, 2022, https://www.conference-board.org/research/us-forecast, retrieved on October 17, 2022.
- The RV shipment data came from the RV Industry Association’s August 2022 market report. https://www.rvia.org/news-insights/august-rv-shipments-top-33000, retrieved on October 17, 2022.


