

Affordability concerns weigh on Indiana housing market outlook for 2023

Senior Demographer, Indiana Business Research Center, Indiana University Kelley School of Business
Indiana’s housing market experienced another dramatic twist in 2022, as rising mortgage rates slowed a two-year run of unprecedented house price gains and cooled off once white-hot buyer demand. Rising costs extended into rental markets with most of the state’s larger metropolitan areas seeing double-digit rent increases over the last year. This helps explain the apartment construction boom currently underway in Indiana (see Table 1). However, there are no signs of any similar uptick in new single-family building to help alleviate the tight conditions that continue to influence the market for existing homes.
Table 1: Indiana housing market by the numbers
| Indiana | U.S. | |
|---|---|---|
| Existing home sales, 2022 Q3, year-over-year change | -10.1% | -20.6% |
| Median sales price, September 2022, year-over-year change | 6.8% | 8.4% |
| Single-family building permits (number of units), September 2022 year-to-date, year-over-year change | -6.2% | -7.4% |
| Multifamily building permits (number of units), September 2022 year-to-date, year-over-year change | 70.5% | 19.0% |
| Months supply of inventory, September 2022 | 1.5 | 3.2 |
| Rental vacancy rate, 2022 Q3 | 8.8% | 6.0% |
| Foreclosure rate, 2022 Q2 | 0.8% | 0.6% |
Sources: Indiana Association of Realtors, National Association of Realtors, U.S. Census Bureau and the Mortgage Bankers Association
Homeowner affordability takes another hit
As Figure 1 highlights, Indiana’s unsustainably high rate of house price appreciation finally began to decline in 2022, with the roughly 7% increase experienced in September the smallest year-over-year change since the early days of the pandemic. However, with 30-year mortgage rates doubling from 3.45% in January of this year to 6.90% in October, these slowing price gains offer little relief to prospective home buyers.
Figure 1: Indiana median sales price of existing homes, year-over-year change
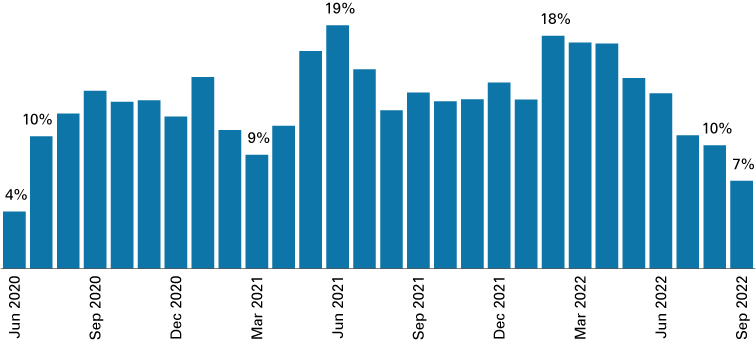
Source: Indiana Association of Realtors
To illustrate how this recent surge in mortgage rates is bringing a chill to housing markets around the state, Figure 2 presents data from the Federal Reserve Bank of Atlanta that compares year-over-year changes in median sales prices for August 2022 to changes in the estimated monthly mortgage payment on the median-priced home over the same period.
In the 11-county Indianapolis metro area, for instance, the median sales price in August 2021 was $251,000, and with mortgage rates slightly below 3%, the monthly payment at this price level was an estimated $1,260. By August 2022, the median sales price increased 15% to $289,000, but with mortgage rates now up to nearly 6%, the monthly payment on the median-priced home was $1,850—a 47% increase year-over-year.
Figure 2: Median sales price and monthly mortgage payment on median price home, August 2022 year-over-year change
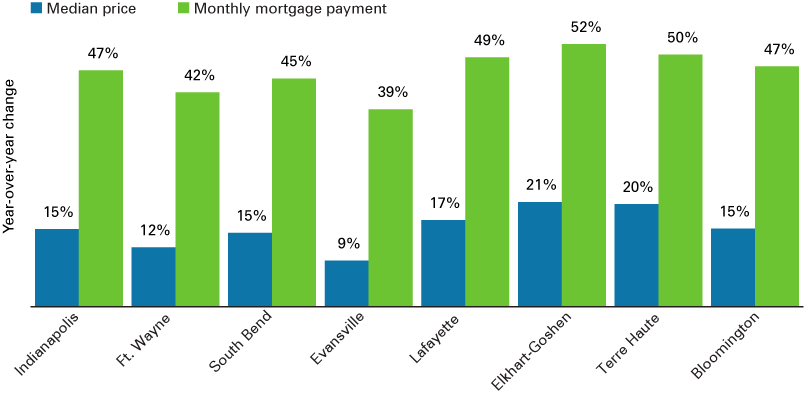
Note: This chart shows the year-over-year change for August 2022. This chart is sorted by overall population size.
Source: Federal Reserve Bank of Atlanta, Home Ownership Affordability Monitor
With this one-two punch of a sustained stretch of rapid price gains coupled with the more recent spike in mortgage rates, homeownership is now considered unaffordable for median-income households in many Hoosier communities (see Figure 3). According to the Atlanta Fed’s Home Ownership Affordability Index—where a value below 100 indicates that housing is unaffordable—Lafayette, Bloomington, Elkhart-Goshen and Indianapolis have the greatest affordability concerns among the state’s largest metro areas.
Figure 3: Home Ownership Affordability Index
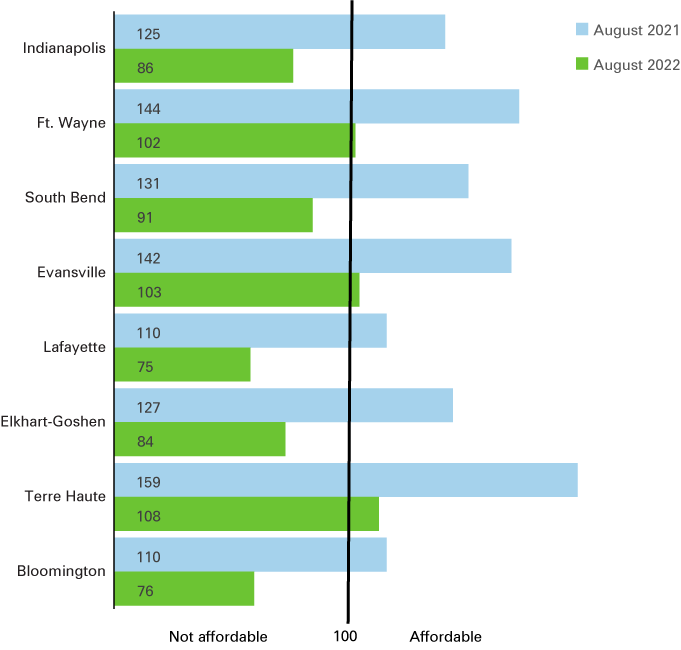
Note: This chart is sorted by overall population size.
Source: Federal Reserve Bank of Atlanta, Home Ownership Affordability Monitor
These dramatic shifts in affordability will likely stifle what has been a broad-based resurgence in homeownership in the state during 2020 and 2021. Fueled by exceptionally low mortgage rates and a temporary surge in savings during the pandemic, Indiana’s overall homeownership rate jumped from 69.3% in 2019 to 71.1% in 2021. Gains were even stronger for younger adult age groups which had seen steep declines in homeownership over the last two decades (see Figure 4).
Figure 4: Indiana homeownership rates by age
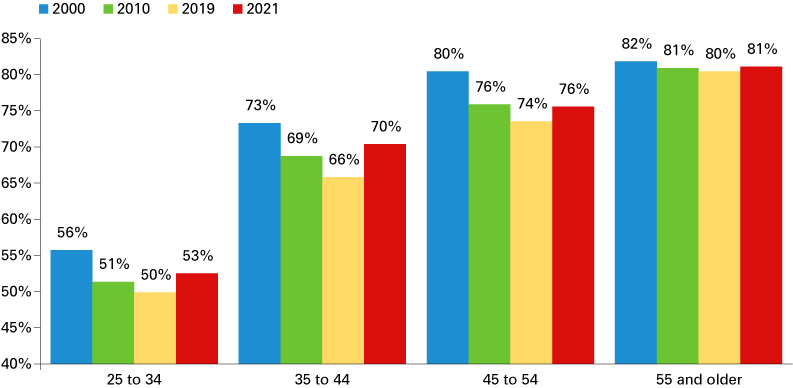
Note: Data not available for 2020.
Source: U.S. Census Bureau
Each of Indiana’s largest race and ethnic groups also saw a boost in homeownership over this period, although wide disparities remain (see Figure 5).
Figure 5: Indiana homeownership rates by race and ethnicity
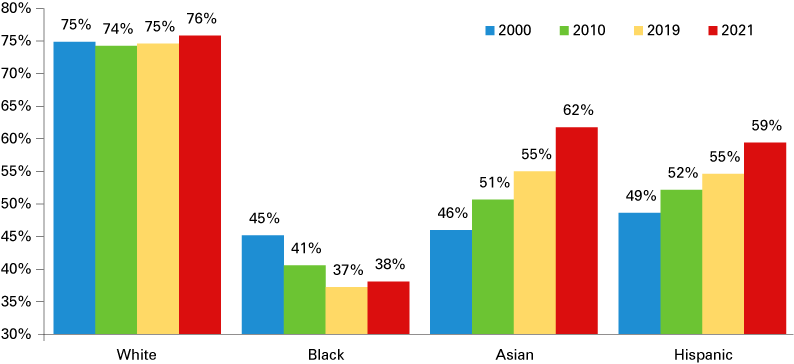
Note: The White group refers to non-Hispanic White residents only. Data not available for 2020.
Source: U.S. Census Bureau
However, recent research from the National Association of Realtors (NAR) shows how declining affordability will likely make this homeownership rebound short-lived. At the national level in 2022, first-time homebuyers as a share of total purchasers was at its lowest level since NAR began collecting this data in 1981, while the typical age of a first-time buyer was the oldest mark on record. Additionally, the share of total homebuyers who were either Black or Asian declined sharply this year.1
Rents on the rise
Hoosier renters are also feeling the effects of higher housing costs. Figure 6 illustrates the trajectory of rent increases in two of the state’s larger metro areas. In the Indianapolis area, rent increases began to pick up pace in the summer of 2020 and climbed as high as a 13.8% annual change in June 2022. This trend started a bit later in the Fort Wayne area, but year-over-year rent increases peaked at more than 18% in May of this year.
Figure 6: Rent increases, year-over-year change
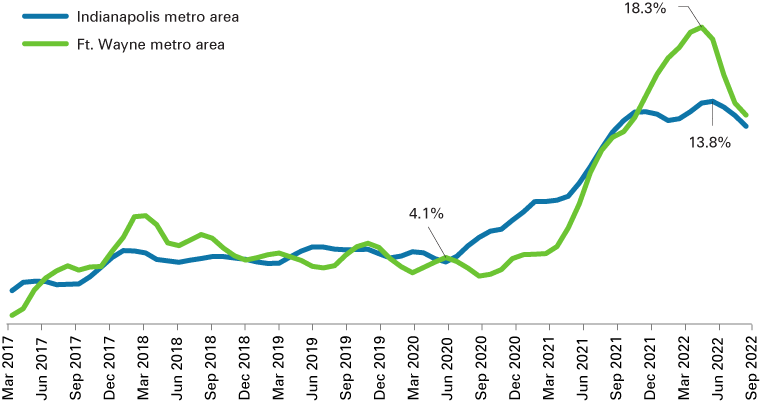
Note: Monthly rent values based on a three-month moving average.
Source: Zillow Research
Changes of this magnitude have been common around the state in 2022. As of the third quarter, Bloomington and South Bend had the largest annual rent increases among Indiana’s larger metro areas, while only Evansville and Terre Haute saw a rate of change in the single digits (see Figure 7).
Figure 7: Rent increases for select metro areas, third quarter 2022 year-over-year change
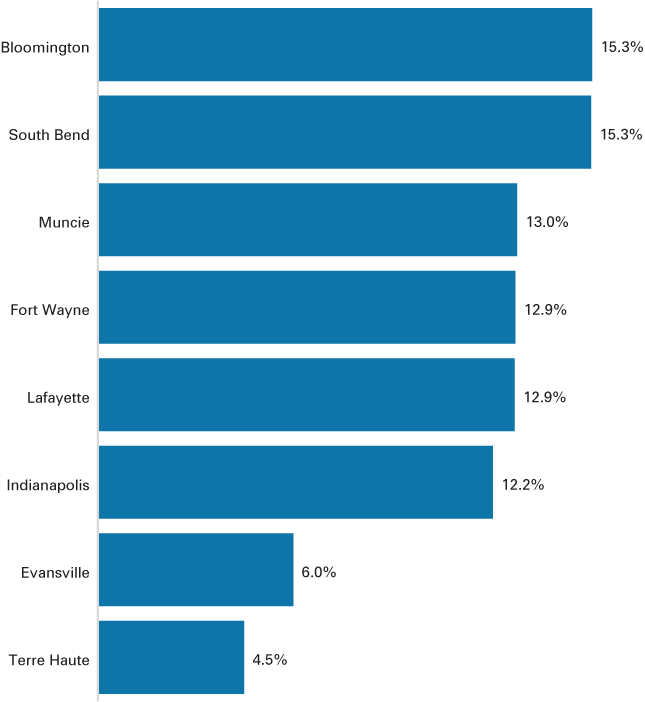
Note: Quarterly rent values based on a three-month average. Data for the Elkhart-Goshen area are incomplete.
Source: Zillow Research, Zillow Observed Rent Index
These surging rents are helping to fuel an unprecedented boom in new apartment developments (see Figure 8). Through the first three quarters of 2022, Indiana saw permits issued for more than 6,500 new units in multifamily structures—a 71% increase over 2021 and 40% above the previous high watermark set in 2000. The Indianapolis metro area accounts for 55% of these new units.
Figure 8: New multi-family units authorized by building permits through September year-to-date
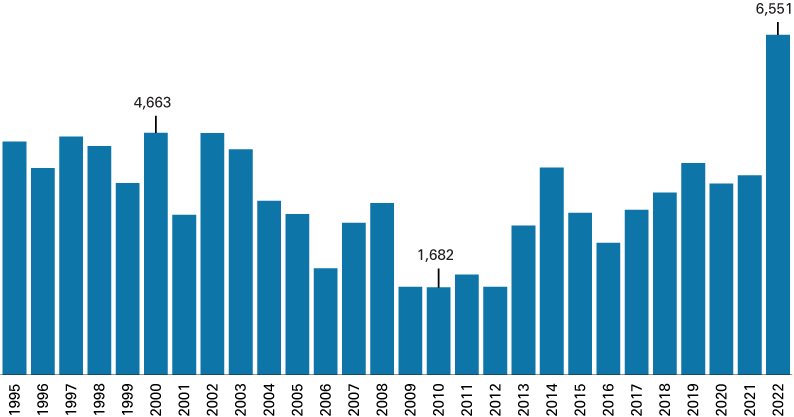
Note: Multifamily refers to structures with five or more units. Data displayed is through September year-to-date.
Source: U.S. Census Bureau
Housing market outlook
Forecasters from the Mortgage Bankers Association and Fannie Mae both have a pessimistic outlook for the U.S. housing market in 2023. According to these analysts, we should expect significant declines in single-family housing starts and existing home sales next year, while the rate of house price appreciation will be essentially flat (see Table 2). One positive note is that mortgage rates are not expected to climb any further in 2023.
Table 2: National housing market outlook
| 2022 | 2023 | Percent change |
|
|---|---|---|---|
| Single-family housing starts (thousands) | 1,014 | 890 | -12.3% |
| Existing home sales (thousands) | 5,105 | 4,349 | -14.8% |
| House price appreciation, annual percent change | 9.4% | -0.4% | - |
| 30-year fixed mortgage rate | 6.0% | 5.9% | - |
Note: The values in this table are an average of the projections from each organization’s October 2022 economic forecasts.
Source: Fannie Mae and Mortgage Bankers Association
Notes
- “2022 profile of home buyers and sellers,” National Association of Realtors, https://cdn.nar.realtor/sites/default/files/documents/2022-highlights-from-the-profile-of-home-buyers-and-sellers-report-11-03-2022_0.pdf
