Indiana’s foreign direct investment and its occupation effects
Senior Economic Research Analyst, Indiana Business Research Center, Indiana University Kelley School of Business
In a companion article, “Indiana’s foreign direct investment since the Great Recession,”1 we looked at state-level job creation through foreign direct investment (FDI) after the Great Recession, offering insights on the state’s influx of outside investment by business functionality, industry and source location. In this article, we specifically look at the occupational dynamic as a result of FDI. After all, people are more interested in the types of job opportunities these investments have brought and will continue to offer.
We measured the investment influx to Indiana using fDi Markets’ unit-level announcement data, which provide detailed location information and classify investments by industrial sectors and subsectors.2 This allowed us to assign records to a county and a North American Industry Classification System (NAICS) code. In order to build an investment profile in terms of occupations—using the Standard Occupational Classification (SOC) system—we estimated occupational headcount by Indiana county using the national industrial staffing pattern from the Occupational Employment Statistics (OES) produced by the U.S. Bureau of Labor Statistics.
Note that we broadened the concept of foreign investors to also include out-of-state domestic investors, since out-of-state investment accounts for 70% of total “foreign” investment made in Indiana. Our focus is the FDIs coming from new investments, leaving out investments involved with expansion or co-location. The time span we looked at ranges from 2007 to 2018. Since the Great Recession started at the end of 2007, FDI accrued in 2007 is considered the pre-recession level.
Overall job demand
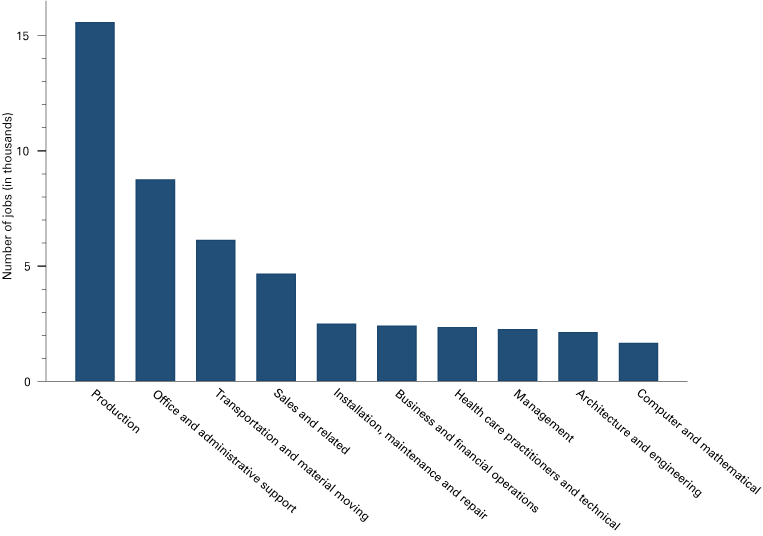
Figure 1 presents Indiana’s top 10 occupational groups (i.e., two-digit SOC codes), measured by total headcounts, from 2007 to 2018. Not surprisingly, production leads the other occupations by a large margin. There were more than 15,000 new production jobs created through foreign investment over the past decade (averaging 1,300 jobs per year). Services workers, especially lower-skilled services (such as office and administrative support, transportation and sales), also benefit from foreign investment. FDI jobs in STEM occupations (such as engineering and computer/mathematical occupations), although having a presence on the top 10 list, are trailing behind.
Figure 1: Total FDI jobs by top 10 occupational groups
Source: IBRC estimates, using fDi Markets data for 2007 to 2018
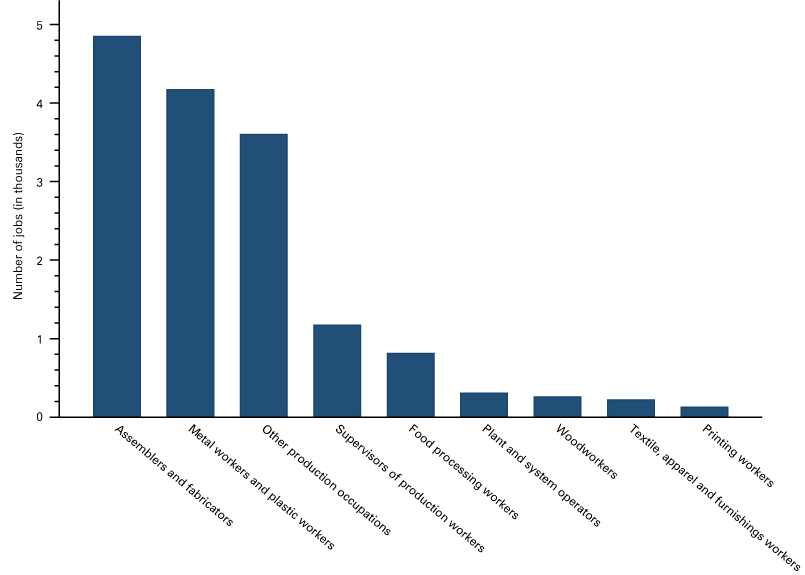
Looking closer at the production occupations, assemblers, fabricators, metal and plastic workers are among the most wanted (see Figure 2). This isn’t surprising, given that auto manufacturing plays such a large role in the state’s economy.
Figure 2: Total FDI jobs in production occupations
Source: IBRC estimates, using fDi Markets data for 2007 to 2018
Occupational dynamic
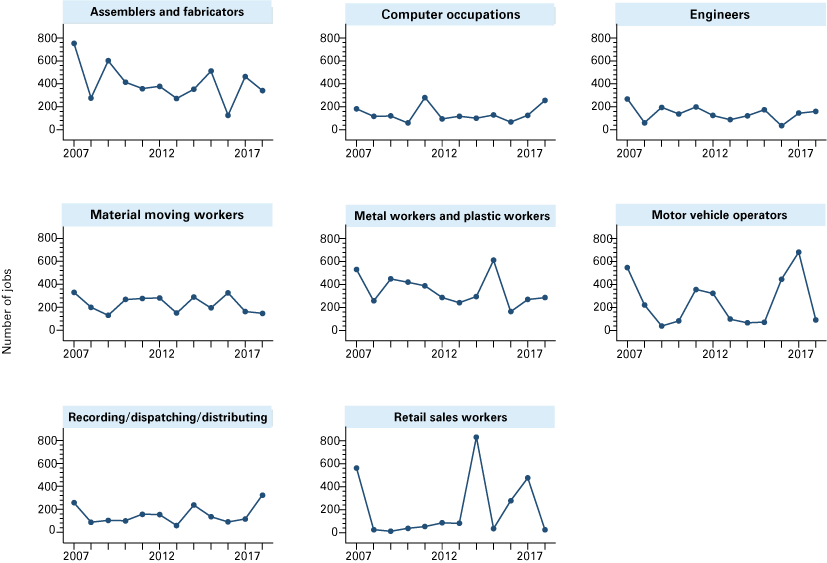
Figure 3 presents the occupational dynamic for some of the state’s top performers (at the three-digit SOC code level). First, notice that new job creation fell for all FDI occupations during the Great Recession. Some occupations (production workers, such as assemblers and fabricators) recovered almost immediately after the recession, while for others (workers in services areas, such as sales) the lingering effect from the economic downturn lasted for quite some time. Material moving workers and motor vehicle operators exhibit some seasonality—alternating between “drought” and “fruitful” years. For example, we tend to see a rise in demand for motor vehicle operators every five years. This is largely attributed to the expansion of the state’s e-commerce, with investors, such as Amazon (distribution centers) and Uber (taxi driver network), strategically investing over time. Job demand for computer and engineer occupations remains steady.
Figure 3: Indiana’s FDI by selected occupations
Source: IBRC estimates, using fDi Markets data for 2007 to 2018
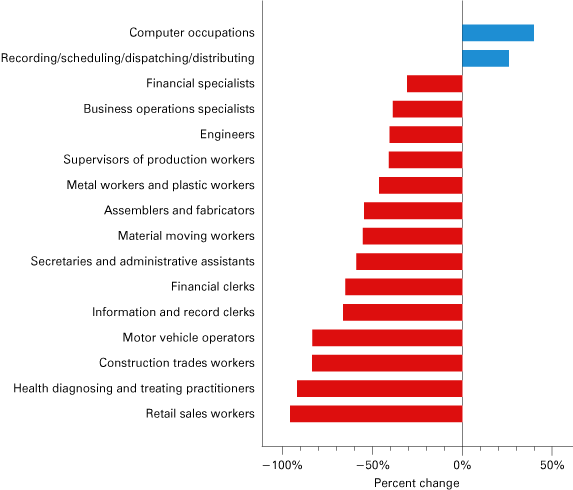
From Figure 3, it seems that overall FDI job demand hasn’t really surpassed its pre-recession level (2007).3 To gain a static view on the progress of foreign direct investment and to make comparison easier, we calculated the cumulative change of job demand for major occupations (three-digit SOC codes), whose total numbers brought by foreign direct investment had exceeded 1,000 during the time period we studied (see Figure 4). Except for computer occupations and bookkeeping, scheduling, dispatching and distributing clerks, job demand for all other occupations has shrunk over time. Demand for retail sales workers has fallen significantly. This, however, isn’t surprising, with people nowadays turning away from brick-and-mortar stores and relying more and more on online shopping, which would also have a negative effect on the demand for construction trades workers, as Figure 4 shows. Demand for production workers (assemblers, fabricators, metal and plastic workers), as well as for material moving workers, has fallen by 50%.
Figure 4: Cumulative change of FDIs for major occupations
Source: IBRC estimates, using fDi Markets data for 2007 to 2018
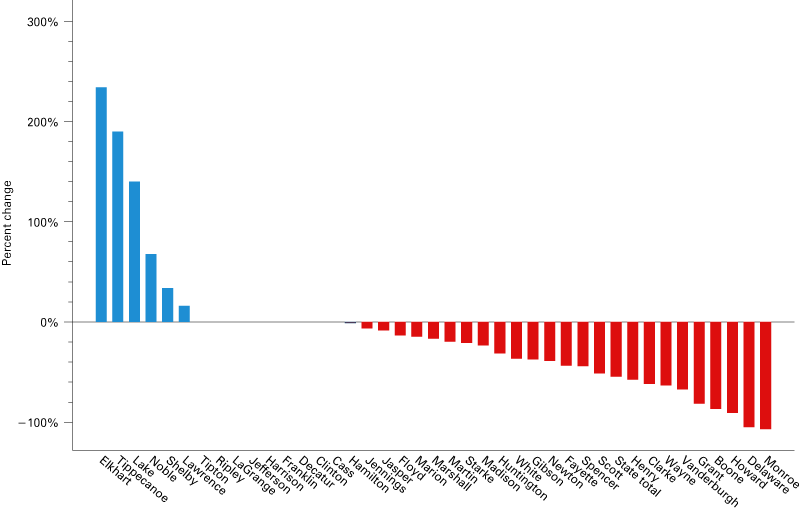
We also explored FDI for Indiana counties by aggregating the cumulative changes of demand for occupations by these new investments. Figure 5 presents the overall change in FDI job demand at the county level for the top 50-percentile counties (in terms of the initial FDI jobs at the beginning of the period we studied).4 It is striking that the majority of counties have experienced a decrease in FDI job demand since the Great Recession. FDI for Indiana as a whole has fallen by 45%. Among the bottom of the list, the FDIs for Monroe and Delaware County (two college communities) have fallen by over 100%.
On the other hand, the top three—Elkhart, Tippecanoe and Lake counties—have seen their FDIs more than double. Indeed, Elkhart’s has more than tripled. For these three counties, foreign direct investments (measured in terms of job demand) not only recovered from the Great Recession, but surpassed their pre-recession levels. Production-oriented counties, such as Decatur (home to Honda), seemed to have fewer setbacks in terms of FDI jobs relative to services-oriented counties, such as Boone. We already saw in Figure 3 that the recovery of demand for production occupations was almost immediate, while the recovery in demand for services occupations took longer.
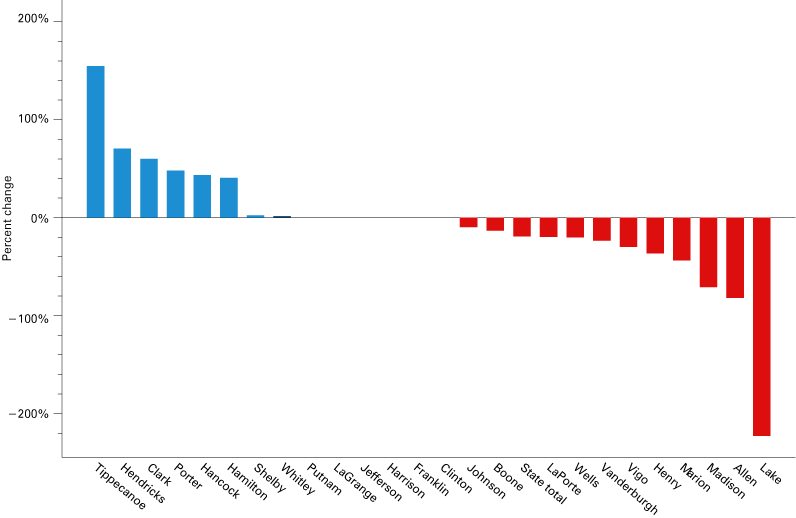
Looking at more recent changes in FDIs among Indiana counties from 2014 to 2018 (what is often considered the post-recession growth period) yields other interesting observations (see Figure 6). Lake County falls from the top to the bottom of the list, suggesting a reduced inflow of new FDI jobs. Tippecanoe (home to Purdue University) remains at the top of the list, suggesting it continues to attract investment.5 FDIs for Indiana as a whole has fallen by 20 percent, but we see upticks for counties specialized in high value-added services, such as Hamilton County, during the past couple of years.
Figure 5: Cumulative change of FDI job demand for selected Indiana counties, 2007 to 2018
Note: Only the top 50-percentile counties in terms of the initial FDI jobs in 2007 are shown in this graphic.
Source: IBRC estimates, using fDi Markets data
Figure 6: Cumulative change of FDI job demand for selected Indiana counties, 2014 to 2018
Note: Only the top 50-percentile counties in terms of the initial FDI jobs in 2014 are shown in this graphic.
Source: IBRC estimates, using fDi Markets data
Conclusion
Indiana’s foreign direct investment over the past decade has created high demand for production workers, and this pattern will likely continue. Demand for low-skilled services workers has shifted from sales to distribution, largely thanks to the booming of e-commerce, which also creates high demand for workers with computer skills. Nevertheless, foreign investment across the state hasn’t returned to its pre-recession level. Foreign investment in high value-added research occupations, such as life science, has been slow. Indiana has multiple initiatives across government and nonprofit industry groups that could yield a greater share of R&D, especially in the life sciences, ag/bio and tech clusters. Thus, we could expect high demand for such occupations in the future.
Notes
- Ping (Claire) Zheng, “Indiana’s foreign direct investment since the Great Recession,” InContext, September-October 2020, www.incontext.indiana.edu/2020/sept-oct/article3.asp.
- fDi Markets is “the most comprehensive online database of cross-border greenfield investments available, covering all countries and sectors worldwide” (www.fdimarkets.com/). Note that fDi Markets “counts” the FDI project the year it is announced with the understanding that it may take years before the investment is fully realized, if the project is realized at all. Thus, one must exercise some caution when using and interpreting these data because fDi Markets uploads the data as announcements are made (thus enhancing its timeliness), but subsequent announcements or adjustments to that particular announcement may not be reflected in the database.
- Be aware that “pre-recession” values are based on only one year’s data. It is possible that a few big investments made in 2007 could be skewing the results. On the other hand, since we see similar trends on all occupations at the state level and across counties, it’s hard to think of 2007 as a special year for foreign investment. Unfortunately, fDi Markets does not provide reliable data prior to 2007.
- In doing so, we eliminated the case where a large percentage change may be inflated as a result of a small calculation base. For example, an increase from two to six jobs gives a 200% growth rate, while going from 200 to 300 jobs is only 50% growth. An investment that warrants 300 jobs would be much more significant than the one that only warrants six jobs. The bottom 50-percentile counties tend to fall into the “small base” category.
- In fact, even after experimenting with different time spans to incorporate the recession/recovery effect, Tippecanoe always remains on the top of the list. Tippecanoe is home to Purdue University, one of the top engineering schools in the nation. The county attracts foreign investments in both R&D and manufacturing (e.g., electrical equipment, power engine and biological manufacturing).


