
Richmond forecast 2019

Director of the Business and Economic Research Center and Associate Professor of Finance, Indiana University East
Several indicators illustrated that economic activity in the Richmond region1 continued to improve, although the momentum in 2018 was not as high as the year before. Total income and per capita income increased by a bigger percentage. The unemployment rate was down a little bit. Wage rates grew less than last year, but the growth rate was still in-line with the national rates. The housing market demonstrated a similar growth pattern as both home sales and median sales price increased at a lower rate. The IU East Regional Business Confidence Index, computed from the responses to the 2018 East-Central Indiana Business Survey, did not increase as much this year as last year. The corresponding Expectation Sub-Index in fact dropped in value. This could be a warning sign for the year ahead.
Income
The total personal income of Wayne County and the region continued their upward trends in 2016 and stayed above their trend lines (see Figure 1), signifying a continuing improvement in the economic activity and living standard in both the county and the region.
Figure 1: Regional and Wayne County total personal income
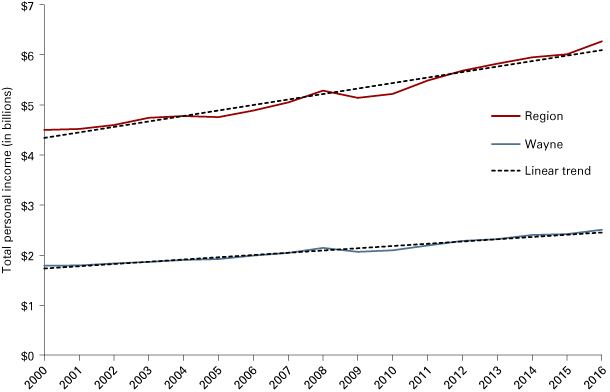
Note: Wayne County has approximately 40 percent of the region's income and 39 percent of its population based on the 2016 data.
Source: U.S. Bureau of Economic Analysis (BEA) Regional Fact Sheets
Figure 2 confirms a similar pattern in per capita personal income (PCPI). According to the most recent data from the U.S. Bureau of Economic Analysis, Wayne County’s total personal income was $2.5 billion in 2016, up by 3.6 percent from the 2015 level, and ranked 27th in the state. Wayne County’s PCPI in 2016 was $37,624, showing an increase of 4.3 percent and ranking 57th in the state.
Figure 2: Regional and Wayne County per capita personal income
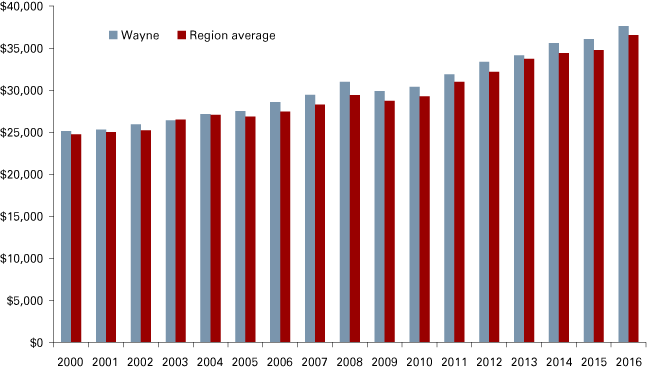
Source: U.S. Bureau of Economic Analysis (BEA) Regional Fact Sheets
In 2016, both Wayne County and Randolph County had higher PCPIs than the regional average, although still below the state and national level (see Figure 3). Wayne County’s PCPI was ranked second in the region after Randolph County whose PCPI was $38,378. The region was underperforming Indiana and the nation in PCPI in 2016 by 15.2 percent and 25.8 percent, respectively.
Figure 3: County-level per capita personal income, 2016
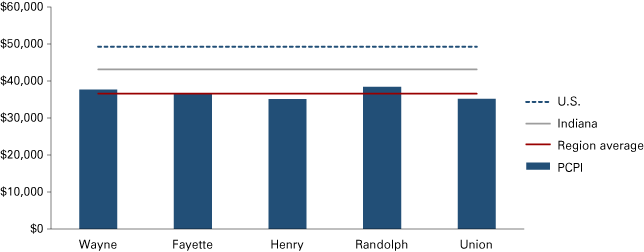
Source: U.S. Bureau of Economic Analysis (BEA) Regional Fact Sheets
Labor market
The average size of the labor force dropped slightly in Wayne County (-0.4 percent) and the region (-0.2 percent) for the first eight months in 2018 (see Figure 4 and Figure 5). Wayne County’s August 2018 labor force was made up of 30,752 people, representing 39 percent of the region’s labor force of 78,052 people for the same time period.
Figure 4: Wayne County’s labor force and unemployment rate
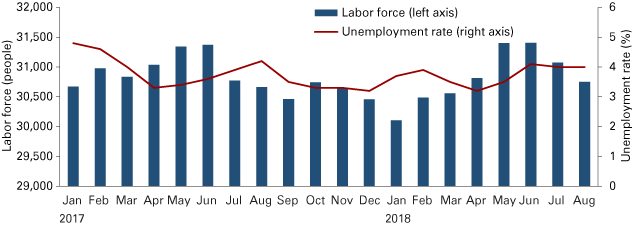
Note: Data are not seasonally adjusted.
Source: Local Area Unemployment Statistics (LAUS) from the U.S. Bureau of Labor Statistics
Figure 5: Regional labor force and unemployment rate
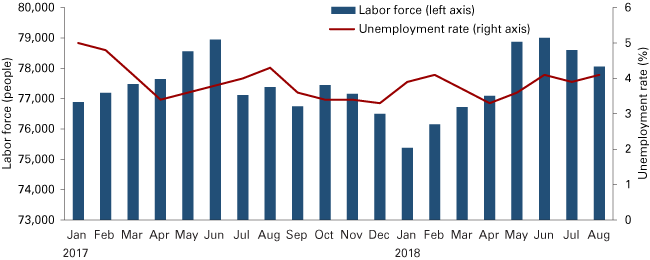
Note: Data are not seasonally adjusted.
Source: Local Area Unemployment Statistics (LAUS) from the U.S. Bureau of Labor Statistics
Both the Wayne County and the regional unemployment rates had leveled out at around 4 percent over the summer (June through August 2018). They stayed close to the national rate, but were still slightly above the state rate by about half a percentage point (see Figure 6). Wayne County’s average unemployment rate for the first eight months in 2018 (3.7 percent) was marginally lower than that of 2017 (4.0 percent).
Figure 6: Unemployment rate comparison, January 2010 to August 2018
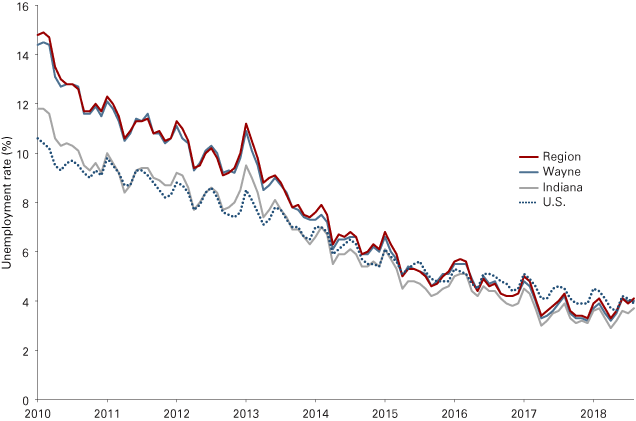
Note: Data are not seasonally adjusted.
Source: Local Area Unemployment Statistics (LAUS) from the U.S. Bureau of Labor Statistics
Jobs and wages
Wayne County saw an aggregate increase of 347 jobs in the first quarter of 2018, representing 71 percent of the total increase in the region (see Table 1). The loss in government jobs (-63) in Wayne County was much more than made up for by the job gain in the private sectors (+410). The sector that had the highest job increase was health care and social services (+368), followed by manufacturing (+220), construction (+144) and administrative, support and waste management (+61). On the other hand, the sector that lost the most jobs was transportation and warehousing (-145), seconded by accommodation and food services (-101).
Table 1: Employment by industry
| Wayne County | Region | |||
|---|---|---|---|---|
| 2018 Q1 | One-year change | 2018 Q1 | One-year change | |
| Total all | 30,167 | 347 | 57,557 | 488 |
| Total private | 25,925 | 410 | 47,507 | 555 |
| Manufacturing | 5,870 | 220 | 11,905 | 389 |
| Retail trade | 3,788 | -52 | 6,867 | -64 |
| Transportation and warehousing | 506 | -145 | 563 | -155 |
| Agriculture, forestry, fishing and hunting | 215 | 7 | 238 | 13 |
| Mining | 21 | 2 | 21 | 2 |
| Utilities | 53 | 1 | 107 | 3 |
| Construction | 796 | 144 | 1,771 | 104 |
| Wholesale trade | 830 | -40 | 1,907 | 64 |
| Information | 199 | -13 | 411 | -24 |
| Finance and insurance | 903 | -13 | 1,486 | -52 |
| Real estate and rental and leasing | 137 | -13 | 352 | 23 |
| Professional, scientific and technical | 457 | 11 | 947 | 164 |
| Management of companies and enterprises | 270 | 1 | 285 | 16 |
| Administrative, support and waste management | 1,873 | 61 | 2,483 | -120 |
| Educational services | 564 | -34 | 594 | -36 |
| Health care and social services | 5,796 | 368 | 8,871 | 286 |
| Arts, entertainment and recreation | 120 | -16 | 331 | 16 |
| Accommodation and food services | 2,871 | -101 | 5,074 | -38 |
| Other services (except public administration) | 656 | 21 | 1,367 | 14 |
| Government | 4,242 | -63 | 10,049 | -69 |
Source: Quarterly Census of Employment and Wayne (QCEW) data from the U.S. Bureau of Labor Statistics, downloaded via Hoosier by the Numbers
The average weekly wage for all jobs in Wayne County increased by 3 percent in the first quarter of 2018 as compared with the same period of 2017 (see Table 2). This increase was higher than the region (2.7 percent), but lower than the state's growth (3.9 percent). The private sector experienced a little higher pay raise, 3.3 percent for both Wayne County and the region, close to the national pay raise of 3.8 percent. The greatest percent increase in average wages in Wayne County was found in educational services (15.9 percent), followed by utilities (11.7 percent) and construction (10.9 percent). Despite increasing by more than 5 percent at the state level, employees in real estate, rental and leasing (–15.6 percent) and management of companies and enterprises (-12.2 percent) had a significant cut in average incomes locally.
Table 2: Average weekly wages
| Wayne County | Region | State | ||||
|---|---|---|---|---|---|---|
| 2018 Q1 | One-year change | 2018 Q1 | One-year change | 2018 Q1 | One-year change | |
| Total all | $756 | 3.0% | $683 | 2.7% | $954 | 3.9% |
| Total private | $762 | 3.3% | $688 | 3.3% | $963 | 4.1% |
| Manufacturing | $930 | 0.3% | $935 | 3.7% | $1,347 | 5.5% |
| Retail trade | $472 | 3.7% | $456 | 2.1% | $535 | 2.7% |
| Transportation and warehousing | $973 | -0.4% | $729 | -8.4% | $870 | 2.1% |
| Agriculture, forestry, fishing and hunting | $671 | -0.1% | $551 | -4.3% | $748 | 4.0% |
| Mining | $753 | -2.0% | $753 | -2.0% | $1,315 | 0.8% |
| Utilities | $3,735 | 11.7% | $2,631 | 9.9% | $2,145 | -1.1% |
| Construction | $846 | 10.9% | $782 | 6.4% | $1,065 | 1.0% |
| Wholesale trade | $967 | 3.8% | $843 | 3.7% | $1,395 | 5.4% |
| Information | $754 | -4.1% | $614 | 0.4% | $1,212 | 3.1% |
| Finance and insurance | $1,079 | 4.3% | $990 | 3.8% | $1,678 | 8.7% |
| Real estate and rental and leasing | $623 | -15.6% | $484 | -0.8% | $946 | 5.6% |
| Professional, scientific and technical | $779 | -6.4% | $647 | 0.7% | $1,309 | 1.6% |
| Management of companies and enterprises | $1,654 | -12.2% | $1,247 | -33.8% | $2,489 | 5.8% |
| Administrative, support and waste management | $524 | 0.0% | $648 | 6.9% | $620 | 2.6% |
| Educational services | $760 | 15.9% | $459 | 14.2% | $726 | 1.4% |
| Health care and social services | $960 | 4.9% | $711 | 5.4% | $906 | 2.5% |
| Arts, entertainment and recreation | $346 | 3.9% | $392 | 14.1% | $677 | -7.3% |
| Accommodation and food services | $286 | 4.8% | $270 | 6.9% | $310 | 3.3% |
| Other services (except public administration) | $490 | 2.5% | $483 | 1.4% | $620 | 2.1% |
| Government | $843 | 2.3% | $772 | 2.2% | $1,058 | 2.1% |
Source: Quarterly Census of Employment and Wayne (QCEW) data from the U.S. Bureau of Labor Statistics, downloaded via Hoosier by the Numbers
Housing market
The number of new single-family building permits (10) issued in Wayne County during the first nine months of 2018 declined compared with the previous two years (18 in 2016 and 13 in 2017), as seen in Table 3. On the other hand, the total proposed cost ($3,468,478 in 2018) remained about the same ($3,450,000 in 2017). These imply that high-valued homes have continued to be in demand. Wayne County as a whole will likely receive similar economic impact from this portion of the economy during 2019 relative to 2018, stimulated by the total spending resulting from the similar total proposed costs across the two years.
Table 3: New single-family building permits in Wayne County
| Building permits issued | Proposed cost | |||||
|---|---|---|---|---|---|---|
| 2016 | 2017 | 2018 | 2016 | 2017 | 2018 | |
| January | 0 | 0 | 0 | $0 | $0 | $0 |
| February | 2 | 1 | 0 | $305,000 | $240,000 | $0 |
| March | 1 | 2 | 1 | $431,000 | $572,000 | $155,000 |
| April | 3 | 2 | 2 | $630,000 | $440,000 | $1,360,500 |
| May | 2 | 2 | 3 | $660,000 | $483,000 | $967,000 |
| June | 2 | 2 | 0 | $430,000 | $1,025,000 | $0 |
| July | 4 | 0 | 1 | $573,000 | $0 | $250,000 |
| August | 3 | 3 | 2 | $375,000 | $495,000 | $505,978 |
| September | 1 | 1 | 1 | $100,000 | $195,000 | $230,000 |
| October | 1 | 3 | n/a | $200,000 | $1,314,000 | n/a |
| November | 2 | 2 | n/a | $375,000 | $829,000 | n/a |
| December | 0 | 1* | n/a | $0 | $110,000 | n/a |
| Yearly total | 21 | 19 | n/a | $4,079,000 | $5,703,000 | n/a |
| Yearly change from prior year | n/a | -9.5% | n/a | n/a | 39.8% | n/a |
| January-September total | 18 | 13 | 10 | $3,504,000 | $3,450,000 | $3,468,478 |
| January-September change from prior year | n/a | -27.8% | -23.1% | n/a | -1.5% | 0.5% |
*This is a modular home.
Source: Wayne County Building Commission, Indiana
In Wayne County, 568 houses were sold between January and August 2018, slightly up by 1.4 percent from the same period of 2017 (see Table 4). The sales in the region resembled a similar upward trend (+1.1 percent). The median price of the home sales in Wayne County was up by 1.7 percent, lower than the corresponding rise of the region by 0.4 percentage points. These suggest that even though home prices were relatively higher, the homes were in fact affordable to more people given the still relatively low (although gradually rising) mortgage interest rates, the steady regional employment and increasing average wages, as well as the tax cut.
Table 4: Year-to-date housing market update
| Closed sales | Median price | |||||
|---|---|---|---|---|---|---|
| 2017 | 2018 | 2018 change | 2017 | 2018 | 2018 change | |
| Statewide | 60,414 | 61,484 | 1.8% | $146,000 | $159,000 | 8.9% |
| Region | 1,060 | 1,072 | 1.1% | $85,000 | $86,825 | 2.1% |
| Wayne | 560 | 568 | 1.4% | $89,950 | $91,500 | 1.7% |
| Henry | 295 | 258 | -12.5% | $86,500 | $86,575 | 0.1% |
| Randolph | 121 | 152 | 25.6% | $73,450 | $76,750 | 4.5% |
| Fayette | 82 | 89 | 8.5% | $65,900 | $71,000 | 7.7% |
| Union | 2 | 5 | 150.0% | $80,050 | $35,000 | -56.3% |
Note: Year-to-date data reflect January through August data.
Source: Indiana Real Estate Market Report by the Indiana Association of Realtors, except Wayne County's data and the region's median price data, which were provided by Better Homes and Gardens First Realty Group
Tracie Robinson of Better Homes and Gardens First Realty Group added that although the real estate market started to experience buyers with more solid employment in 2017 and this continued to remain steady through 2018, homes sales in 2018 (+1.4 percent) in Wayne County did not increase as much as in 2017 (+10.9 percent) due to the relatively low inventory in the market. At the same time, property prices in Wayne County were in tandem with buyer’s employment pay rates, both of which were steady and similar to those of 2017. The higher increase in the regional median sales price was a result from the increase in the selling of small acreage properties on the outskirts of small towns, with particular popularity of homes between one and three acres in the areas surrounding Wayne County. On the other hand, both of the indicators for Wayne County and the region were still underperforming those at the Indiana state level.
Outlook
The IU East Business and Economic Research Center conducted its third East-Central Indiana Business Survey in September-October 2018. The survey was to collect the opinions of various aspects of business performance and the projection of the overall regional business and economic conditions from the owners or managers of businesses located in the five counties in the region (including Fayette, Henry, Randolph, Union and Wayne). Their responses related to the actual performance for this year and the expected performance for 2019, together with their projection on the overall business and economic condition in the region, are summarized and analyzed to form the conclusion on the business outlook for the region. In addition, these responses were also used to compute the value of the 2018 IU East Regional Business Confidence Index (IUERBCI) to continue gauging the business and economic pulse of the region.
The survey responses gave rise to a value of 106.1 points for the 2018 IUERBCI (see Table 5), higher than last year by 2.1 points (or 2.0 percent). This indicated that the business community in this region continued to hold an optimistic view about conducting their business activities in the region. However, the rising momentum in their confidence was just about half of the year before. A breakdown of the index into its sub-indexes illustrated that the regional business community was having much higher confidence in the current economic performance of the region for this year (as expressed by the 112.4 points from the Present Situation Index) than in the future performance for next year (as expressed by the 99.9 points from the Expectation Index). In fact, they casted a somewhat slightly pessimistic appraisal for next year.
Table 5: IU East Regional Business Confidence Index and its sub-indexes
| 2016 (base year) | 2017 | 2018 | |
|---|---|---|---|
| IU East Regional Business Confidence Index Value | 100 | 103.98 | 106.08 |
| Annual Change | - | 4.0% | 2.0% |
| Present Situation Index Value | 100 | 107.11 | 112.43 |
| Annual Change | - | 7.1% | 5.0% |
| Expectation Index Value | 100 | 101.06 | 99.9 |
| Annual Change | - | 1.1% | -1.2% |
Source: The 2018 East-Central Indiana Business Survey, conducted by IU East Business and Economic Research Center, September-October 2018
When asked to compare this year (2018) with the same period in the previous year, over 65 percent of the participants reported that their firms had increased production/business activity (see Table 6). Over 90 percent of the surveyed firms had hired the same number or more employees. At the same time, less than 6 percent of the firms had cut back on their capital investment slightly. Although the majority (60 percent) of the participants reported an increased cost of doing business, a larger portion (85 percent) of the firms managed to maintain the same or make higher profits.
Table 6: Compared to the same period last year, how has each of the following changed for your business/company?
| Answer options | Has increased significantly (>5%) | Has increased slightly (<5%) | Has remained about the same | Has decreased slightly (<5%) | Has decreased significantly (>5%) | Response count |
|---|---|---|---|---|---|---|
| Production/business activity | 33.7% | 31.6% | 25.3% | 7.4% | 2.1% | 95 |
| Number of employees | 12.5% | 22.9% | 56.3% | 5.2% | 3.1% | 96 |
| Capital investment | 14.9% | 33.0% | 46.8% | 5.3% | 0.0% | 94 |
| Cost of doing business | 7.3% | 53.1% | 36.5% | 3.1% | 0.0% | 96 |
| Profitability | 20.2% | 28.7% | 36.2% | 12.8% | 2.1% | 94 |
Source: The 2018 East-Central Indiana Business Survey, conducted by IU East Business and Economic Research Center, September-October 2018
Similarly, in the comparison of this year (2018) with the next year on the same aspects, only 4 percent of the participants would expect their firms to reduce production/business activity slightly (see Table 7). Over 90 percent of surveyed firms would expect to continue hiring the same number or more employees. Only 4 percent of the firms would expect to reduce their capital investment slightly. Even though 66 percent of the surveyed business executives anticipate an increase in the cost of doing business, over half (52 percent) of them were looking forward to generating higher profits. A larger portion of the survey participants were concerned about the cost of doing business and a smaller portion anticipated higher profit for next year than this year. This contributed to the lower point value of the Expectation Index and the slower growth in the point value of the Regional Business Confidence Index.
Table 7: How do you anticipate each of the following will change next year for your business/company as compared with this year?
| Answer options | Will increase significantly (>5%) | Will increase slightly (<5%) | Will remain about the same | Will decrease slightly (<5%) | Will decrease significantly (>5%) | Response count |
|---|---|---|---|---|---|---|
| Production/business activity | 22.1% | 37.9% | 35.8% | 4.2% | 0.0% | 95 |
| Number of employees | 7.4% | 20.0% | 64.2% | 7.4% | 1.1% | 95 |
| Capital investment | 9.6% | 31.9% | 54.3% | 4.3% | 0.0% | 94 |
| Cost of doing business | 5.3% | 61.1% | 32.6% | 1.1% | 0.0% | 95 |
| Profitability | 13.8% | 38.3% | 41.5% | 6.4% | 0.0% | 94 |
Source: The 2018 East-Central Indiana Business Survey, conducted by IU East Business and Economic Research Center, September-October 2018
Over 60 percent of the survey participants were optimistic about the overall business and economic conditions in 2019 in the region (see Table 8). Only about 12 percent held a moderately pessimistic view. A quarter of them believed that the conditions would remain about the same.
Table 8. How do you project the overall business and economic conditions in 2019 in your area?
| Answer option | Response percent | Response count |
|---|---|---|
| Strongly optimistic | 14.6% | 14 |
| Moderately optimistic | 49.0% | 47 |
| About the same | 25.0% | 24 |
| Moderately pessimistic | 11.5% | 11 |
| Strongly pessimistic | 0.0% | 0 |
| Total | 100.0% | 96 |
Source: The 2018 East-Central Indiana Business Survey, conducted by IU East Business and Economic Research Center, September-October 2018
In accordance with International Monetary Fund projections,2 the projection for global growth has been revised down to 3.7 percent for 2018 and 2019 from their original April forecast by 0.2 percentage points. While the U.S. will experience strong growth brought about by fiscal expansion, growth of other advanced economies are likely to slow down. Pressure from exchange rates, higher borrowing costs and capital outflows may hinder growth in emerging markets and low-income economies. The global growth forecast could be brought further down by a trade dispute intensification. The U.S. economy is expected to grow at 2.9 percent in 2018 and 2.5 percent in 2019, together with lower unemployment rates and additional inflationary pressures. Projections for 2018 and 2019 of real GDP growth made by the Federal Open Market Committee (FOMC), as announced in the press release for their September 2018 meeting, are 3.1 percent and 2.5 percent, respectively.3 Thus, both IMF and FOMC have arrived at the same projection of 2.5 percent for the U.S. growth in 2019. In fact, Wall Street has demonstrated worry over this deceleration of global economic growth and the raising of interest rates by the Federal Reserve. This outlook was even considered as the most pessimistic one since November 2008.4
Summary
Similar to the projections for global and national economic growth, Wayne County and the region will likely experience a slowdown in growth next year as predicted by the IU East Regional Business Confidence Index. The unemployment rate is expected to be a little higher than the current level of 4 percent. While the region may get some ripple effects from the global trade tension, increasing interest rates will add further to the cost of doing business and buying homes in Wayne County and the region. Depending on the industry sectors, some of them may see slower growth in both employment and wages either in Wayne County, the region or both.
Facing possibly slower economic growth in the region in the year ahead, government, enterprises and individuals all may want to prepare themselves for any surprises and continue to be vigilant in monitoring the economic environment.
Acknowledgements
The author deeply appreciates the feedback and support provided by Dr. Litao Zhong, the former director of the IU East Business and Economic Research Center. Thanks also go to Tracie Robinson, broker associate/sales manager of Better Homes and Gardens First Realty Group, for the provision of housing data for Wayne County and the region, as well as Debbie Bailey of the Office of Building Commission for the provision of data on building permits issued in Wayne County.
Notes
- The Richmond region includes the five east-central Indiana counties, notably Fayette, Henry, Randolph, Union and Wayne.
- International Monetary Fund, “World Economic Outlook: October 2018–Challenges to Steady Growth,” October 2018.
- Federal Open Market Committee, “Transcript of Chairman Powell’s Press Conference,” September 2018.
- Jessica Menton, “More Investors Are Wary”, Wall Street Journal, October 18, 2018, B10.

The Indiana Business Review is a publication of the Indiana Business Research Center at Indiana University's Kelley School of Business. Permission to use the material is encouraged, but please email us at ibrc@iu.edu to indicate you will be using the material and in what other publications. Privacy Notice